Features
GROWER SURVEY 2023
Plans for 2023 and beyond: Growers share future plans as well as highlights and challenges from 2022
May 30, 2023 By Andrew Snook
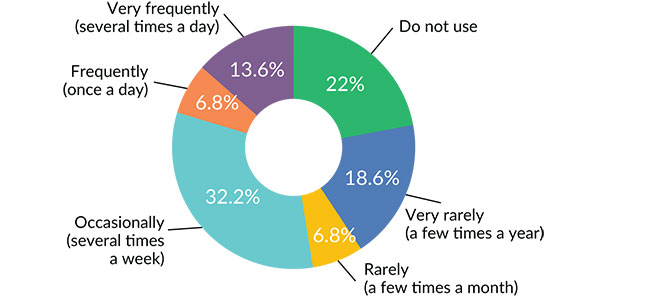 Do you use social media (e.g. Facebook, Twitter, Instagram, Pinterest, etc.) to follow industry news
and/or to market your products/services?
Do you use social media (e.g. Facebook, Twitter, Instagram, Pinterest, etc.) to follow industry news
and/or to market your products/services? The Greenhouse Canada Grower Survey results are in, offering a snapshot of the greenhouse sector for 2022 and beyond.
WHO ANSWERED?
Growers across Canada answered the call for this year’s Grower Survey with 81 participants from the controlled environment agriculture sector. It is best to treat these results as informal and anecdotal, because some of the growers selected a mix of different growing spaces and/or crops, which will not necessarily add up to 100.
Of the growers that participated, 78 per cent were growing in greenhouses, 18 per cent identified as growing in an indoor, non-vertical farm (and not a greenhouse) or other, while 4 per cent were in vertical farming.
For the growers that identified themselves as ornamental and garden growers, the primary operations identified were led by wholesale growers (51 per cent) followed by young plant growers (44 per cent) and retail growers (39 per cent). For the growers that identified themselves as vegetable (produce) growers , the primary operations identified were led by retail growers (42 per cent), followed by wholesale growers (32 per cent) and young plant growers (24 per cent). When broken down by province, the majority of growers were located in Ontario (47 per cent), followed by B.C. (17 per cent), Alberta (10 per cent), and additional representation from Saskatchewan, Manitoba, Nova Scotia, New Brunswick and Quebec.
More than 54 per cent of respondents worked in operations measuring under 50,000 sq. ft., while 14 per cent worked in operations over 1,000,000 sq. ft., 9 per cent worked in operations 350,001 to 500,000 sq. ft., just over 7 per cent worked in operations 500,001 to 1,000,000 sq. ft., 6 per cent worked in operations 50,001 to 100,000 sq. ft., 5 per cent worked in operations 100,001 to 200,000 sq. ft., and the remining 5 per cent worked in operations 200,001 to 350,000 sq. ft.
Growers were also asked to identify the crops they primarily grow. The frontrunners (not exhaustive) were: garden vegetable plants (41 per cent); ornamental bedding plants (36 per cent); flowering potted plants (35 per cent); peppers (30 per cent); tomatoes (28 per cent); cucumbers (27 per cent); tropicals (22 per cent); perennials (20 per cent); leafy greens (19 per cent); herbs (17 per cent); plugs and propagation material (16 per cent); strawberries (10 per cent); cut flowers (10 per cent); eggplant (9 per cent); cannabis (7 per cent); trees and shrubs (7 per cent); microgreens (6 per cent); and woody ornamentals (5 per cent).
When asked who their customers are, 40 per cent of growers identified wholesalers, followed by mass merchandisers/box stores and grocery stores (35 per cent); other growers (32 per cent); their own retail shops (27 per cent); and independent garden centres, independent retailers and florists (27 per cent).
SALES AND PROFITS IN 2022
When asked how sales compared in 2022 to 2021, 46 per cent of growers stated sales were stronger in 2022. More than 18 per cent of respondents stated they were up more than 10 per cent; 15 per cent stated they were up between 5 and 10 per cent; and 13 per cent stated they were up less than 5 per cent.
Another 14 per cent of growers stated no change in sales, while more than 15 per cent of growers stated they were down more than 10 per cent; followed by 8 per cent down between 5 and 10 per cent; and 4 per cent down less than 5 per cent. The remaining growers (13 per cent) stated they did not know if their sales were better or worse in 2022.
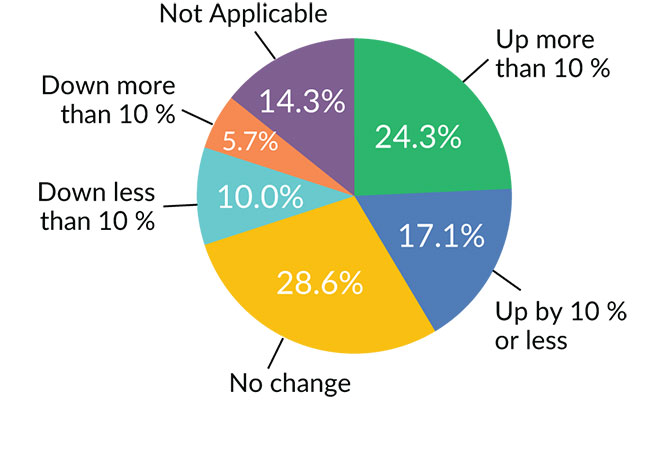
While sales were up with 46 per cent of growers, only 30 per cent of respondents stated that their profit margins were up, with 26 per cent up 10 per cent or less, and only 4 per cent up more than 10 per cent. Just over 28 per cent of growers stated there was no change in profit margins, while 15 per cent of growers’ profit margins were down more than 10 per cent; 11 per cent of growers’ profit margins were down 5 per cent or less; and 6 per cent of groers’ profit margins were down between 5 and 10 per cent.
What are your sales forecasts (volumes) for 2023 compared to 2022?
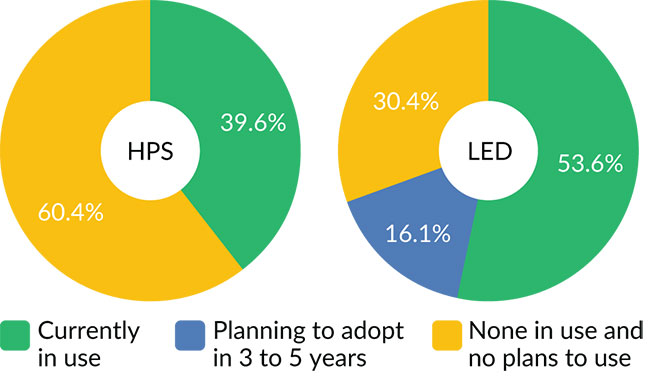
Are you using supplemental lighting in your crops?
FORECASTING
When looking at pricing in the near future, the majority of growers (56 per cent) were planning on increasing prices in 2023 with 21 per cent increasing prices between 5 to 9 per cent; 21 per cent increasing prices less than 5 per cent; and 14 per cent raising prices more than 10 per cent. Approximately 25 per cent of respondents stated they would not change their prices, while 4 per cent stated they would be reducing prices.
In regards to sales forecasts, 41 per cent of respondents stated they were expecting higher sales compared to 2021, while 29 per cent of growers are expecting lower sales and another 29 per cent expecting no change.
INPUTS
Several input costs increased for growers in 2022. The most common were labour and wages (53 per cent); fertilizers and nutrients (45 per cent); heating (42 pre cent); electricity (34 per cent); pots, trays and containers (31 per cent); growing media (28 per cent); and plant material (23 per cent). Other input cost increases noted by some growers included biocontrols (13 per cent); marketing/sales (8 per cent); taxes (8 per cent); and conventional pesticides (5 per cent).
When it came to supplemental lighting, growers showed a significant increase in the use of LED lighting with 54 per cent of respondents stating they are currently using LED lighting (compared with 34 per cent in the 2021 Grower Survey). 40 per cent of growers stated they were currently using HPS. Another 16 per cent of growers stated they were planning on adopting LED lighting in the next three to five years.
LABOUR
Labour was the leading input cost in 2022 with 60 per cent of growers stating the amount of labour they employed in 2022 compared to 2021 stayed about the same. 21 per cent of respondents stated their labour employed this year rose by up to 10 per cent, while 13 per cent stated their labour employed increased by more than 10 per cent.
When forecasting future labour needs, more than 63 per cent of growers stated they expect their labour needs to be about the same, while 19 per cent expect an increase of up to 10 per cent, and 11 per cent of respondents expect their labour needs to increase by more than 10 per cent. Just over 6 per cent of growers expect their labour needs to decrease by 10 per cent or less.
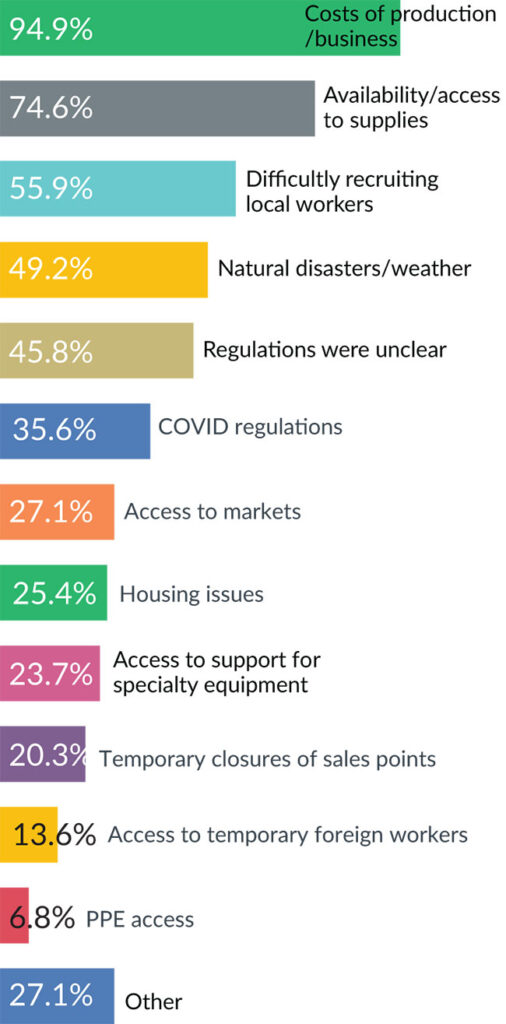
What were your biggest challenges in 2022?
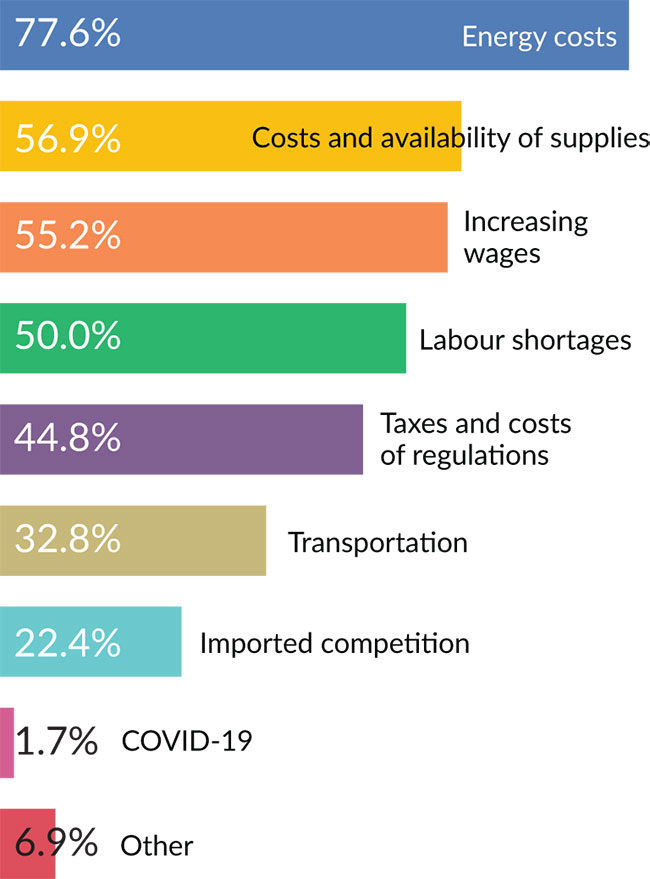
Which of the following do you see as business threats in the next 3 to 5 years?
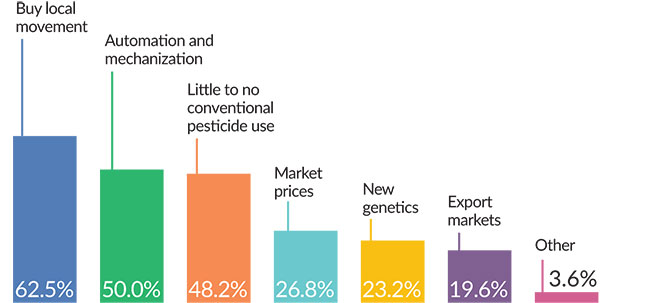
Which of the following do you see as opportunities in the next 3 to 5 years?
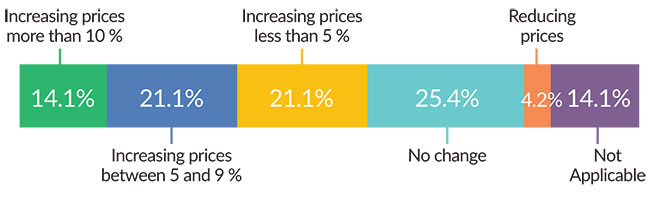
Price changes for 2023? Overall, are you:
EXPANSION
Expansion was not in the plans for the majority of growers in 2022 with over 76 per cent stating no expansion. Just over 15 per cent of respondents stated they expanded less than 10,000 sq. ft.; while less than 5 per cent expanded between 25,001 and 50,000 sq. ft.; and 3 per cent stated they expanded between 10,001 and 25,000 sq. ft. This trend continued when asked about 2023 expansions plans with 76 per cent of growers stating they had no plans for expansion, followed by 17 per cent stating they are planning expansions of less than 10,000 sq. ft.
FUTURE INVESTMENT
When asked about investing in new equipment and technologies in 2022, 65 per cent stated they invested in new equipment with 8 per cent of growers investing more than $100,000 in their operations; 13 per cent of growers investing $25,001 to $100,000; 10 per cent investing between $10,001 and $25,000; 11 per cent investing between $5001 and $10,000; 8 per cent investing between $1,000 and $5,000; and 15 per cent investing less than $1,000.
While the number of growers expecting to invest in new equipment and technologies in 2023 dropped to 56 per cent, 10 per cent are forecasting spending more than $100,000; while another 18 per cent are expecting to invest between $25,001 to $100,000.
Biocontrols and biopesticides
When managing mites and insect pests, over 35 per cent of respondents stated their use of biocontrol agents and biopesticides increased, while 40 per cent of respondents had no change, 5 per cent identified a decrease in use, and 19 per cent stated they did not use them.
When managing disease, 25 per cent of respondents stated their use of biocontrol agents and biopesticides increased, while over 52 per cent of respondents had no change, and 22 per cent stated they did not use them.
Print this page