According to this year’s Greenhouse Canada Grower Survey, 2013 was a pretty good year for the industry.
According to this year’s Greenhouse Canada Grower Survey, 2013 was a pretty good year for the industry.
 |
|
| Pest pressures were higher last year compared to 2012. Advertisement
|
That’s fuelled a lot of optimism for continued growth this year. Growers want to buy more and hire more this year compared to 2013.
Most growers (56 per cent) are hiking prices this year, and that’s a good thing. Inputs are rising, and you can only cushion inflation so long with increased efficiency.
Some 66 per cent of growers anticipate more sales this year, while 31 per cent expect at least the same amount of product will go out the door this year as was shipped in 2013.
If there is a note of caution, it came in the questions related to profit margins. The number of respondents who don’t know their margins remains in double digits. Accurate costing of each crop is so important.
Due to rounding to whole numbers, the responses won’t always add up to 100 per cent. (Bracketed numbers are from last year’s survey.)
And now without further adieu, on with the survey results.
WHAT TYPE OF GREENHOUSE OPERATION ARE YOU?
With last year’s responses in brackets, 33 per cent (36) of respondents were wholesale growers; 32 per cent (35) were retail growers; 26 per cent (25) were vegetable growers, and nine per cent (four) were young plant growers.
WHERE ARE YOU LOCATED?
Geographically, the regions with the largest percentage representation included Ontario with 48 per cent (51), British Columbia with 20 per cent (18), Alberta with 12 per cent (11), Saskatchewan with eight per cent (five), and Manitoba with six per cent (seven).
SIZE OF YOUR OPERATION?
Far and away the largest sampling in our survey were growers with less than 50,000 square feet. Some 54 per cent of respondents were in this category, compared to 56 per cent last year. About 19 per cent (17) were in the 50,000 to 100,000 sq. ft. range, while 12 per cent (eight) have greenhouses in the 100,001 to 200,000 sq. ft. range. Rounding out the responses were: 200,001 to 350,000 sq. ft., five per cent (five per cent); 350,001 to 500,000 sq. ft., five per cent (five per cent); 500,001 to one million sq. ft., four per cent (five per cent); and over one million sq. ft., almost two per cent.
THE MAJORITY OF YOUR SALES ARE TO:
Leading responses included “your own retail shop” at 36 per cent, “wholesale/distributors” at 22 per cent, “farmers’ markets” at 14 per cent, and “supermarkets/grocery stores” at 11 per cent. Sales to “independent garden centres” were listed by six per cent of respondents, while “mass merchandisers/box stores” represented only four per cent. About three per cent of sales went to “other growers.”
WHICH OF THE FOLLOWING ARE YOUR SECONDARY MARKETS?
“Your own retail shop” led the category with 19 per cent, closely followed by “independent garden centres” with 16 per cent, “farmers’ markets” at 14 per cent, and “wholesale/distributors” at 12 per cent. Rounding out the responses were: “independent retailers/florists” with 11 per cent, “supermarkets/grocery stores” at 10 per cent, “other growers” with nine per cent, “mass merchandisers/box stores” with seven per cent, and “auctions” with two per cent.
 |
|
| ‘What is your primary crop?’
|
WHICH IS YOUR PRIMARY CROP?
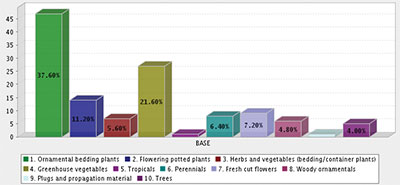
Strongly represented in this year’s survey were “bedding plants” with 38 per cent (27), followed by “greenhouse vegetables” with 22 per cent (26), “flowering potted plants” with 11 per cent (17), “fresh cut flowers” with seven per cent (10), “perennials” with six per cent (four), “herbs and vegetables (bedding/container plants)” with six per cent (10), “woody ornamentals” with five per cent (three), and “trees” with four per cent). With less than one per cent were “tropicals” (two) and “plugs/propagation material” (four).
WHAT ARE YOUR OTHER CROPS?
Leading the representation in this category were “herbs and vegetables (bedding/container plants)” with 17 per cent (21), “flowering potted plants” with 15 per cent (15), “perennials” with 15 per cent (15), “greenhouse vegetables” with 13 per cent (eight), and “foliage” with nine per cent (eight). Rounding out the category were “ornamental bedding plants” with eight per cent (nine), “plugs/propagation material” with eight per cent (four), “trees” with six per cent (seven), “woody ornamentals” with eight per cent (three), and “fresh cut flowers” with three per cent (seven).
WHAT IS YOUR ANNUAL SALES VOLUME?
In talking about revenues, the “under $50,000” category led the way with 24 per cent (22) of respondents, followed by “$100,001 to $500,000” with 20 per cent (21), “$500,001 to $1 million” with 16 per cent (17), and “$50,001 to $100,000” with 15 per cent (14). Other categories represented this year included
- “$1 million to $2 million” with nine per cent (12), “over $5 million” with eight per cent (seven), and
- “$2 million to $3 million” with six per cent (six)
HOW DO YOUR 2013 SALES COMPARE TO 2012?
Based on survey responses, last year was a much, much better experience in terms of sales than was 2012. While 26 per cent of respondents said the years matched up squarely in terms of sales, 25 per cent reported sales increases of more than 10 per cent, while 20 per cent rang in an extra five to 10 per cent in 2013 compared to the previous year. Eighteen per cent had sales increases of up to five per cent, year over year. That was the good news. About five per cent of respondents, however, had sales decreases of up to five per cent, three per cent had decreases of between five and 10 per cent, and three per cent had declines of more than 10 per cent.
WHAT WAS YOUR PROFIT MARGIN IN THE PREVIOUS FISCAL YEAR (2012)?
 |
|
| Nine per cent heat with wood, up from five per cent in 2012
|
The percentage of respondents who didn’t know their profit margins rose to 23 per cent this year from last year’s survey (19 per cent). At every conference we attend, there is at least one presentation on the importance of knowing profit margins on each crop, and this has also been a common theme in articles by columnist Melhem Sawaya in these pages over the past 25 years or so. If it’s not properly “cost,” you probably “lost” on it.
Also worrying was that 10 per cent of respondents had “zero” profit margins in the previous year. That’s clearly unsustainable over the long haul.
Among respondents with balance sheets at hand, some 24 per cent had profit margins of between 11 and 19 per cent (16), 20 per cent were in the five to 10 per cent range (21), while 15 per cent had profit margins of less than five per cent (14). Seven per cent were more than 20 per cent (18).
WHAT WAS YOUR PROFIT MARGIN THREE YEARS AGO?
Some 22 per cent didn’t know in this year’s survey, compared to 17 per cent in last year’s survey. The results were generally positive: those with over 20 per cent profit margins – five per cent of respondents (16); 11 to 19 per cent profit margins – 18 per cent of respondents (18); five to 10 per cent profit margins – 21 per cent of respondents (17); less than five per cent profit margins – by 21 per cent of respondents (15). Twelve per cent posted “none” as their response this year, compared to 15 per cent in last year’s survey.
PRICES FOR 2014; WHAT ARE YOU PLANNING?
Respondents are remaining cautious with the market, tending to rein in price adjustments this year. Some six per cent are boosting prices by more than 20 per cent (five); 29 per cent are looking at hikes of between five and nine per cent (19); 21 per cent are looking at modest increases of up to five per cent (31); and 44 per cent of growers are holding the line this year (44). This latter finding is worrisome; input prices are continuing to rise, and increased efficiencies can only go so far to reduce costs of production. Consumers will always pay for quality and experience; Canadian plants and vegetables excel at both, and growers should expect a good return on their crop investment.
- Agree or disagree; send an e-mail to greenhouse@annexweb.com.
WHAT ARE YOUR SALES FORECASTS (VOLUMES) FOR 2014 COMPARED TO 2013?
Here is where we expected to see market confidence … and we weren’t disappointed! Only three per cent of growers are anticipating fewer products going out the door this year (six). Some 39 per cent are expecting an increase of up to 10 per cent (32) and 27 per cent anticipate increases of greater than 10 per cent (27). Some 31 per cent see similar sales this year compared to 2013 (33).
WHAT’S GOT YOU BUGGED?
The next few questions deal with seasonal pest pressures. The overwhelming majority of growers said problems in 2013 were about the same as 2012. (In brackets are the responses in last year’s survey comparing 2012 and 2011.)
- Early season (January through March): worse in 2013 – 10 per cent (two); same – 78 per cent (76); not as bad – 13 per cent (22).
- Spring, (April through June): worse in 2013 – 16 per cent (12); same – 63 per cent (61); not as bad – 21 per cent (27).
- Summer (July through September): worse in 2013 – 13 per cent (19); same – 71 per cent (60); not as bad – 15 per cent (21).
- Autumn (October through December): worse in 2013 – 13 per cent (six); same – 70 per cent (81); not as bad – 17 per cent (13).
DIAGNOSTICS
Similarly, the next set of questions dealt with disease pressures. Again, the vast majority of growers said problems last year were about the same as they experienced in 2012. (In brackets are the responses in last year’s survey, which compared 2012 to 2011.)
- Early season (January through March): worse in 2013 – three per cent (one); same – 87 per cent (87); not as bad – 10 per cent (12).
- Spring, (April through June): worse in 2013 – six per cent (seven); same – 83 per cent (74); not as bad – 11 per cent (19).
- Summer (July through September): worse in 2013 – six per cent (11); same – 79 per cent (74); not as bad – 15 per cent (15).
- Autumn (October through December): worse in 2013 – six per cent (six); same – 80 per cent (81); not as bad – 14 per cent (nine)
WHICH INPUT COST ROSE THE MOST IN 2013 COMPARED TO 2012?
Echoing last year’s survey, “labour” tops this category with 24 per cent of respondents listing this as rising the most in 2013, but it’s not as dominant an issue as it was last year (37). As noted last year, if there are areas you can automate, make the investment. Labour costs will continue to rise.
“Heating” ranked second with 19 per cent and it’s definitely a reflection of the cold winter experienced across most of Canada this past winter; only 11 per cent of respondents last year selected it.
“Electricity” rounded out the Big Three with about 15 per cent of responses, compared to 12 per cent in last year’s survey.
Other leading input increases included “containers/labels” by seven per cent (not listed among the top items last year); “fertilizers” by six per cent (10), “biocontrols” by five per cent (not among top items last year), “chemicals” by five per cent (not among top items last year), “plant material” by five per cent (three), and “taxes (property, payroll, environmental, permits, etc.)” by five per cent (not among top items last year).
PRIMARY HEATING FUEL
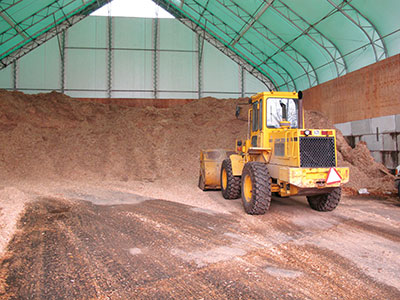
No surprises here, with “natural gas” the fuel of choice for 50 per cent of respondents (63). Other leading choices include “propane” at 14 per cent (five), “no heating system” by 11 per cent (eight), “oil” at 10 per cent (nine), and “wood” at nine per cent (five per cent). “Coal” usage remains at three per cent, the same as last year. Rounding out the list were “other renewables (biomass, geothermal, biogas)” at three per cent (six).
EMPLOYMENT IN 2013 COMPARED TO 2012
There was some growth in employment last year, though most growers – 63 per cent – maintained their 2012 levels (70). About eight per cent (six) increased employment by more than 10 per cent, and 16 per cent hired up to 10 per cent more employees (17). As for downsizing, seven per cent cut up to 10 per cent of their workforce (three), while six per cent dropped more than 10 per cent (four).
EMPLOYMENT FORECAST IN 2014 COMPARED TO 2013
There will be many “Help Wanted” ads posted this year. While the majority of respondents – 72 per cent – said they will maintain their current levels (71), some six per cent expect to grow by more than 10 per cent, and 14 per cent more will welcome up to 10 per cent more employees. About four per cent expect to cut by up to 10 per cent, and three per cent plan cuts of more than 10 per cent.
 |
|
| ‘Does your greenhouse have a website?’
|
DID YOU EXPAND/BUILD IN 2013?
It was a “stand pat” kind of year for most growers, as 78 per cent of respondents didn’t take out building permits, compared to 85 per cent last year. About 17 per cent put up less than 10,000 sq. ft. (20), while three per cent added between 10,000 and 25,000 sq. ft. (seven). About two per cent added more than 100,000 sq. ft.
HOW MUCH DO YOU PLAN TO EXPAND/BUILD IN 2014?
About 76 per cent said they have no immediate expansion plans this year, while 14 per cent have projects of less than 10,000 sq. ft. About five per cent are planning projects of between 10,000 and 25,000 sq. ft., and another five per cent are looking at expanding by between 25,000 and 50,000 sq. ft.
DID YOU INVEST IN NEW EQUIPMENT/TECHNOLOGY IN 2013?
Some 36 per cent said they didn’t buy new equipment last year (37). Eleven per cent spent less than $10,000 (11); 18 per cent – between $1,000 and $5,000 (14); 14 per cent – between $5001 and $10,000 (12); seven per cent – between $10,001 and $25,000 (12); seven per cent – between $25,001 and $100,000 (nine); and seven per cent – more than $100,001 (five).
DO YOU PLAN TO INVEST IN NEW EQUIPMENT IN 2014?
Most growers will be “kicking tires” this buying season, according to our survey. While 41 per cent have no spending plans, eight per cent will spend less than $1,000; 15 per cent – $1,001 to $5,000; 10 per cent – $5,001 to $10,000; 13 per cent – $10,001 to $25,000; 10 per cent – $25,001 to $100,000; and three per cent – more than $100,001.
USE OF BIOCONTROLS IN 2013 COMPARED TO 2012
Most growers continued the course last year, with 48 per cent saying they made no change in their programs (54). Twenty-seven per cent increased their usage (23), while three per cent reported a decline (zero). Twenty-two per cent do not use biocontrols, the same as was seen in last year’s survey.
ANTICIPATING BUSINESS THREATS IN NEXT THREE TO FIVE YEARS
Given grower feedback to our survey, we would rank them as follows, major to minor:
- Energy costs.
- Markets/prices.
- Taxes/regulations (property, payroll, environmental, etc.)
- Imported competition.
- Currency fluctuations.
- Labour shortages.
Energy costs are weighing heavily on the minds of growers as they look ahead. Forty-nine per cent are “somewhat” worried, while 42 per cent are “very worried.” The remainder is “not at all” worried.
Markets/prices are also troubling considerations. Fifty-seven per cent said they were “somewhat” worried, while 37 per cent are “very” worried. The remaining six per cent are “not at all” worried.
One of the areas governments can be a little more supportive of the industry is in the area of Taxes/Regulations (property, payroll, environmental, permits, etc.). Forty-five per cent are “somewhat” worried and 39 per cent are “very” worried. Sixteen per cent are “not at all” worried.
Imported competition is a concern for most growers. Thirty-four per cent are “somewhat” worried and 29 per cent are “very” worried. However, 37 per cent aren’t losing much sleep over it.
Currency fluctuations are “somewhat” worrying for 49 per cent, with a further 13 per cent “very” worried. About 39 per cent are “not at all” bothered.
Labour shortages are not a concern for half our respondents, while 39 per cent are “somewhat” worried, and 11 per cent are “very” concerned.
EYEING BUSINESS OPPORTUNITIES IN NEXT THREE TO FIVE YEARS?
Viewing our survey feedback, we would list them as follows, major to minor:
- Buy local movement.
- Non-traditional products.
- Organic or green products.
- Export markets.
The “buy local” movement is having an impact, and will continue to do so for the foreseeable future. It’s become an economic mantra for every provincial government. In our survey, 46 per cent said it’s a “very” big opportunity, while 42 per cent say it will be “somewhat” of an opportunity. The remainder doesn’t see it as an opportunity “at all.”
“Non-traditional products” are embraced “somewhat” by 49 per cent, while 31 per cent are quite keen on them. Twenty per cent aren’t placing much stock in them, at least for the present.
“Organic or green products” are “somewhat” of an opportunity for 51 per cent of growers, while 28 per cent are quite excited by them. Twenty-one per cent are “not at all” banking on them as new opportunities.
Some 63 per cent are “not at all” eyeing “export markets” for expansion, while 23 per cent see “somewhat” of an opportunity to grow into them. Fourteen per cent are quite keen on those new markets.
WHO ARE OUR READERS?
Greenhouse Canada remains a valuable resource for growers across Canada, according to our most recent demographic survey.
Some 81 per cent of respondents said the magazine is “important” or “very important” to them in keeping up-to-date with the industry.
The survey was conducted last August and September.
Some 82 per cent of readers have studied at the post-secondary level. Seventy-three per cent are at the managerial level or higher.
Fifty-one per cent have been in the industry for more than 16 years, while 31 per cent have 10 years or less of experience.
Slightly more than a third (36 per cent) of companies in the survey have five to 24 employees, while 22 per cent have one to four. On the other side of the scale, seven per cent have 500 or more employees in total.
Over 88 per cent of readers are involved in suggesting or approving purchases, and 45 per cent are actively involved in purchases above $500,000 in value.
Asked how many people read each issue, 53 per cent said “two to four,” while 32 per cent said they were the only readers.
How well does the magazine hold the attention of readers? Sixty-five per cent read it “cover to cover” or at least “most of the articles.” Some 79 per cent have read at least three of the last four issues they received, while 70 per cent have read all four.
Fifty-five per cent visit the Greenhouse Canada website at least once a month.
Print this page