Features
Expanding Sight: Plant health beyond the naked eye
Hyperspectral imaging takes plant health monitoring to a whole new level. Here’s how it works.
November 15, 2021 By Dr. Michael Taschuk, Nicholas Kalogirou and Hal Friesen
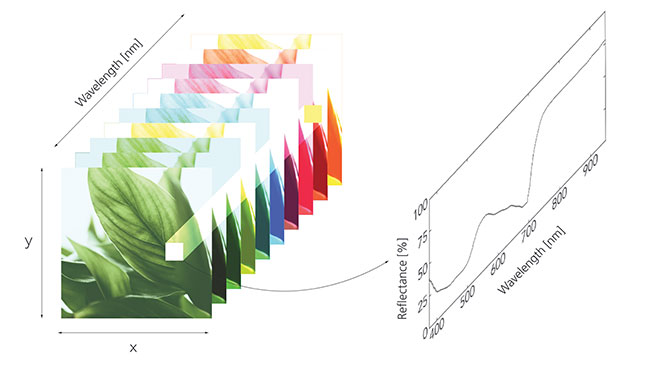 FIGURE 1: A typical “hypercube” of data gathered by a hyperspectral imager, where we have a stack of images with slight variations as a function of colour (or wavelength). Looking at a single pixel in the cube (plotted on the right) for example, can provide a lot of insight into plant health. (Reflectance plot generated using sample data from Riedell and Blackmer, 1999.)
all image credits: G2V Optics
FIGURE 1: A typical “hypercube” of data gathered by a hyperspectral imager, where we have a stack of images with slight variations as a function of colour (or wavelength). Looking at a single pixel in the cube (plotted on the right) for example, can provide a lot of insight into plant health. (Reflectance plot generated using sample data from Riedell and Blackmer, 1999.)
all image credits: G2V Optics The human eye evolved to see light from blue to red, but reflected light from plants conveys significant information outside of these wavelengths. By looking outside the visible spectrum, new technology can induce a paradigm shift for plant health monitoring and reach beyond common environmental variables like temperature, humidity, and CO2 content.
This technology is known as hyperspectral imaging. To understand how it works, let’s use your phone as an example.
The digital camera records a red, green and blue image for every photograph you take. These three images combine into the colours that humans can see with the naked eye. When applied to plants, each image pixel has three values that can quantify plant or leaf properties. However, much more information can be obtained if more colours (or wavelengths beyond red, green and blue) are measured – a technique referred to as spectroscopy.
Hyperspectral imaging technology combines imaging and spectroscopy to grant data-based insight into the world of what we see, as well as beyond what we can’t see. A good visual summary of the information provided by a hyperspectral imager is in the “hypercube,” a stack of images taken at different colours, shown in Figure 1. By probing, for example, a single pixel as a function of colour, a lot of information and insight can be gleaned. In the example here, the percent reflection of a single pixel is plotted as a function of wavelength, and as we’ll see later in this article, there’s a plethora of information in a single pixel of this “hypercube.”
Hyperspectral imaging provides data suitable for monitoring a wide range of plant conditions such as nitrogen status, infections, maturity index, and plant stress as a result of drought, unfavourable temperatures and other factors. Most importantly, hyperspectral imaging provides early detection of these signals. This article will introduce how this is done and highlight some of the potential opportunities that hyperspectral imaging can offer crop growers.
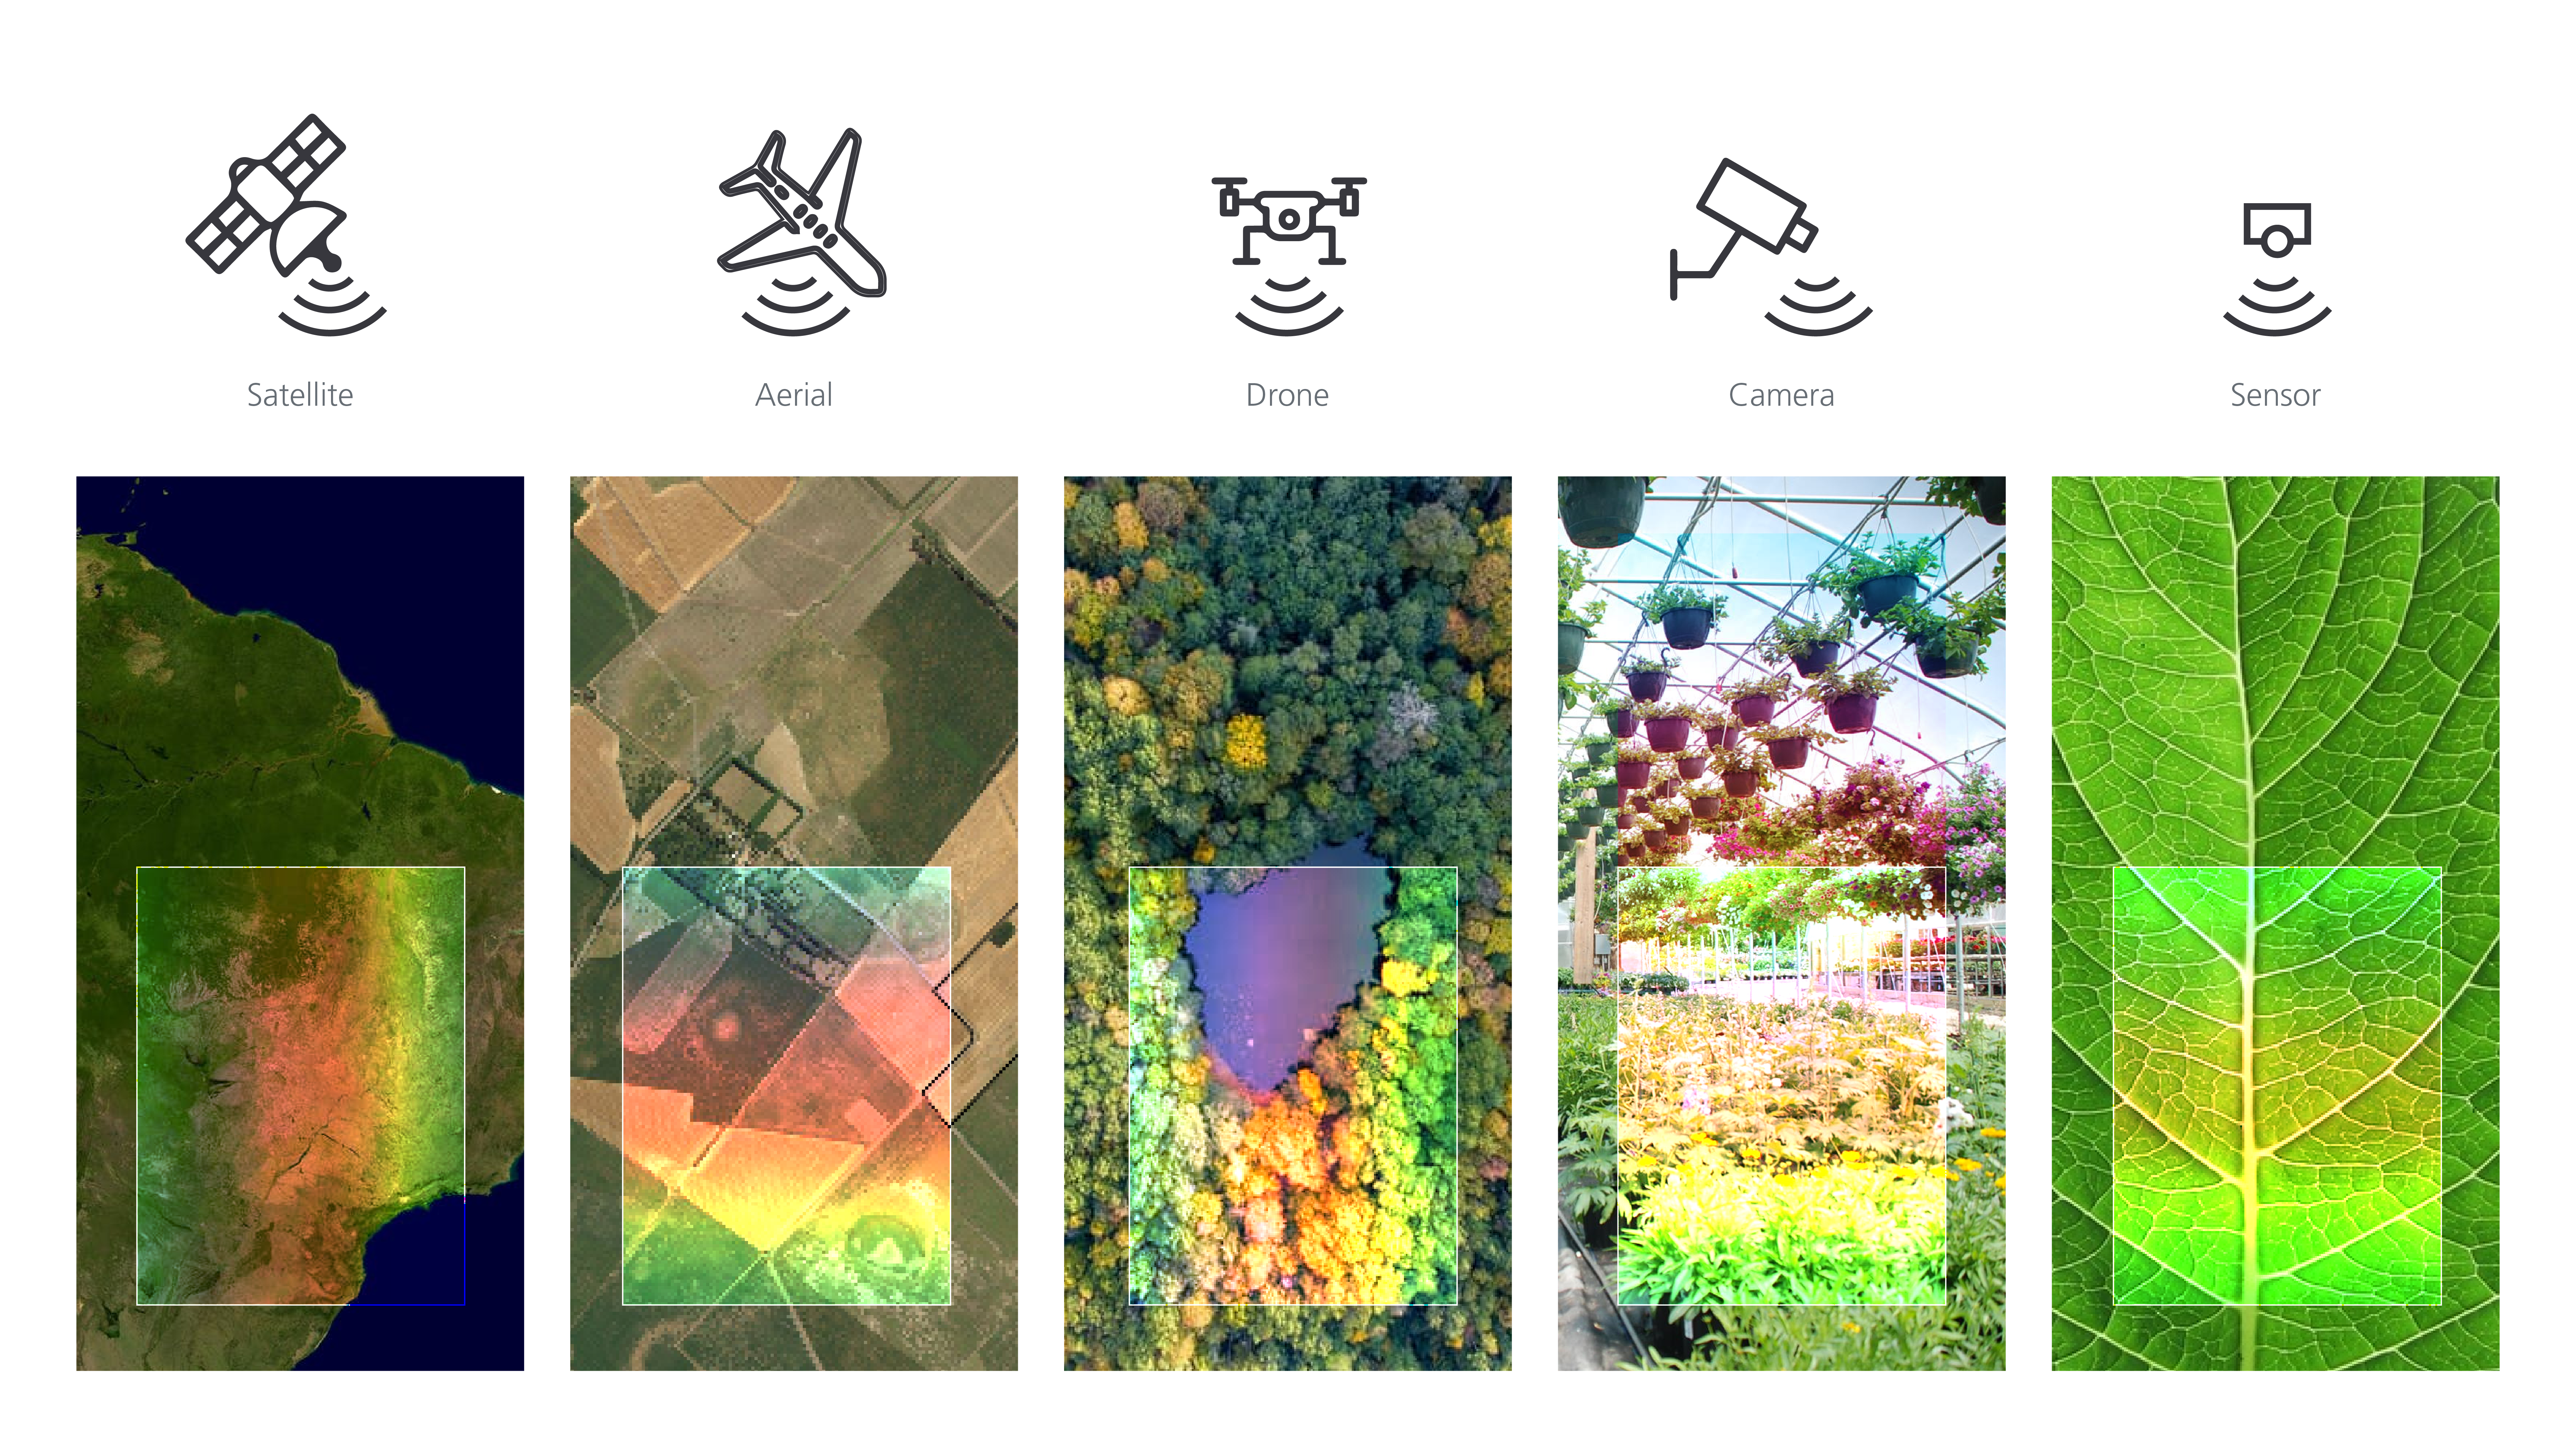
A visual representation of the scale and timeline of hyperspectral imaging development. Satellite surveys of land areas with hyperspectral imagers have gradually transitioned to aerial surveys, drone surveys, camera monitoring, and finally into single-crop sensing as hyperspectral technology has advanced and dropped in cost
A Brief History of Plant Hyperspectral Imaging
Hyperspectral imaging has its roots in precision agriculture and climate monitoring, going back to as early as the 1980s [Mulla, 2013]. Early hyperspectral imagers were so expensive that having a single camera monitor a wide area was all that was feasible. The camera resolution and number of spectral bins (the most familiar of which are the three red, green and blue bins of RGB cameras) determined how much insight you could really get into any plant characteristic.
As hyperspectral imaging technology advanced, its cost decreased so it could be used first in aerial monitoring, then in hand-held applications. Today, hyperspectral imaging technology is comparatively more affordable than it used to be. Though its capital costs are still largely out of reach for the majority of greenhouse operations, continued research offers the potential for its use within sensors to monitor plants affordably.
Outside of scale and cost, imagers and analytical capabilities have advanced significantly. Spatial and spectral resolution have improved, and knowledge of crop response to specific chemicals, behaviours, and stresses has enhanced the technique’s usefulness. This insight is obtained without invasive tests, making it very attractive for crop growers monitoring living plants.
Expanding operations can scale their sensor-to-grower ratio, augmenting human skills and expertise across a larger greenhouse area. This is important both in remote and indoor farm operations. Sensors can also give you more unbiased, continuous, and permanently stored data.
To really appreciate the benefits of modern hyperspectral imaging, though, we need to understand the different plant features that allow this technology to provide deep insights.
Visible Plant Signatures
Plants use visible light for photosynthesis; it’s also what growers rely on to inspect crops. By eye, growers can identify many damaged or diseased plants, but not all. Images in the visible spectral region offer many insights that growers may not be able to immediately identify, such as the presence of nutrient deficiencies, diseases and pests [Zubler and Yoon, 2020].
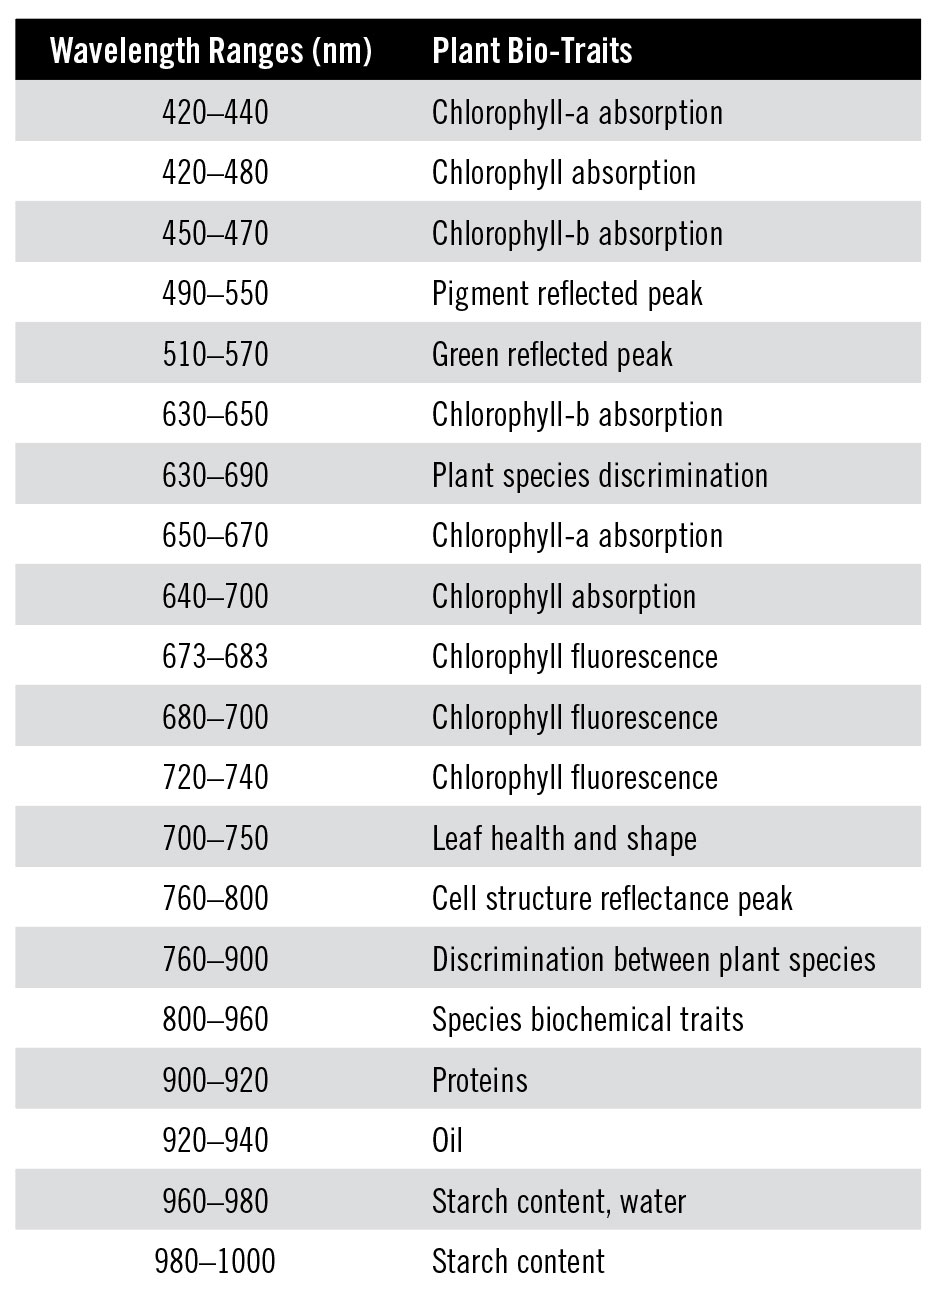
Wavelength ranges for specific plant traits, reproduced from Peng et al., 2019.
The chlorophyll pigments, key molecules involved in photosynthesis, absorb blue and red light [Peng et al., 2019], but reflect green light, causing the plant’s green appearance. Chlorophyll is also where most leaf nitrogen is stored, and so provides an indirect way to estimate a plant’s nutrient status [Blackburn, 2007]. Chlorophyll concentration generally decreases as a plant is stressed, and so measuring it can indicate how a plant is interacting with its environment.
Chlorophyll fluoresces in the red to near-infrared region [Peng et al., 2019]. Fluorescence refers to a material absorbing light at one colour, and re-emitting at another colour. A familiar example is fluorescent safety clothing. Chlorophyll fluorescence indicates how much chlorophyll pigment is present, but requires information outside the visible wavelength range.
Many other molecules besides chlorophyll interact with visible light. One example is anthocyanins, a pigment type that can regulate photosynthesis, protect the plant from overly intense light, and adjust osmosis to protect it during freezing or drought periods [Blackburn, 2007]. Anthocyanins are still being studied to determine the roles they play in a plant’s function. In the past, they were only detectable through chemical analysis, but improvements to hyperspectral imaging have allowed scientists to detect it through the pigment’s absorption in the red-green region [Blackburn, 2007]
Red-edge Plant Signatures
Chlorophyll pigments have a sharp cutoff at the visible spectrum’s red end, where they no longer absorb but instead reflect light. The exact “red-edge” wavelength shift can indicate chlorophyll concentration in plants and canopies [Blackburn, 2007].
By comparing the red-edge location to the wavelength where the reflectance shows the smallest change, we can also calculate the concentration of oxidized compounds in stressed leaves [Guan et al., 2005]. Extending a bit beyond red wavelengths grants access to far more plant information. What if we go even further into the infrared?
Infrared Plant Signatures
The electromagnetic spectrum’s infrared portion is what we feel as heat. Wavelengths from 700 nm to 2,000 nm are known as near-infrared.
Inside plants, their water, proteins, cellulose and lignin all determine how much near-infrared light is reflected [Elvidge, 1990]. Beyond providing molecular signatures, infrared reflection provides insight into structural changes in the leaf, and therefore can detect damage from pests such as leaf miners [Xu et al., 2007]. When a healthy plant is stressed, diseased or infected, its reflectivity and scattering of infrared light will change in a measurable way.
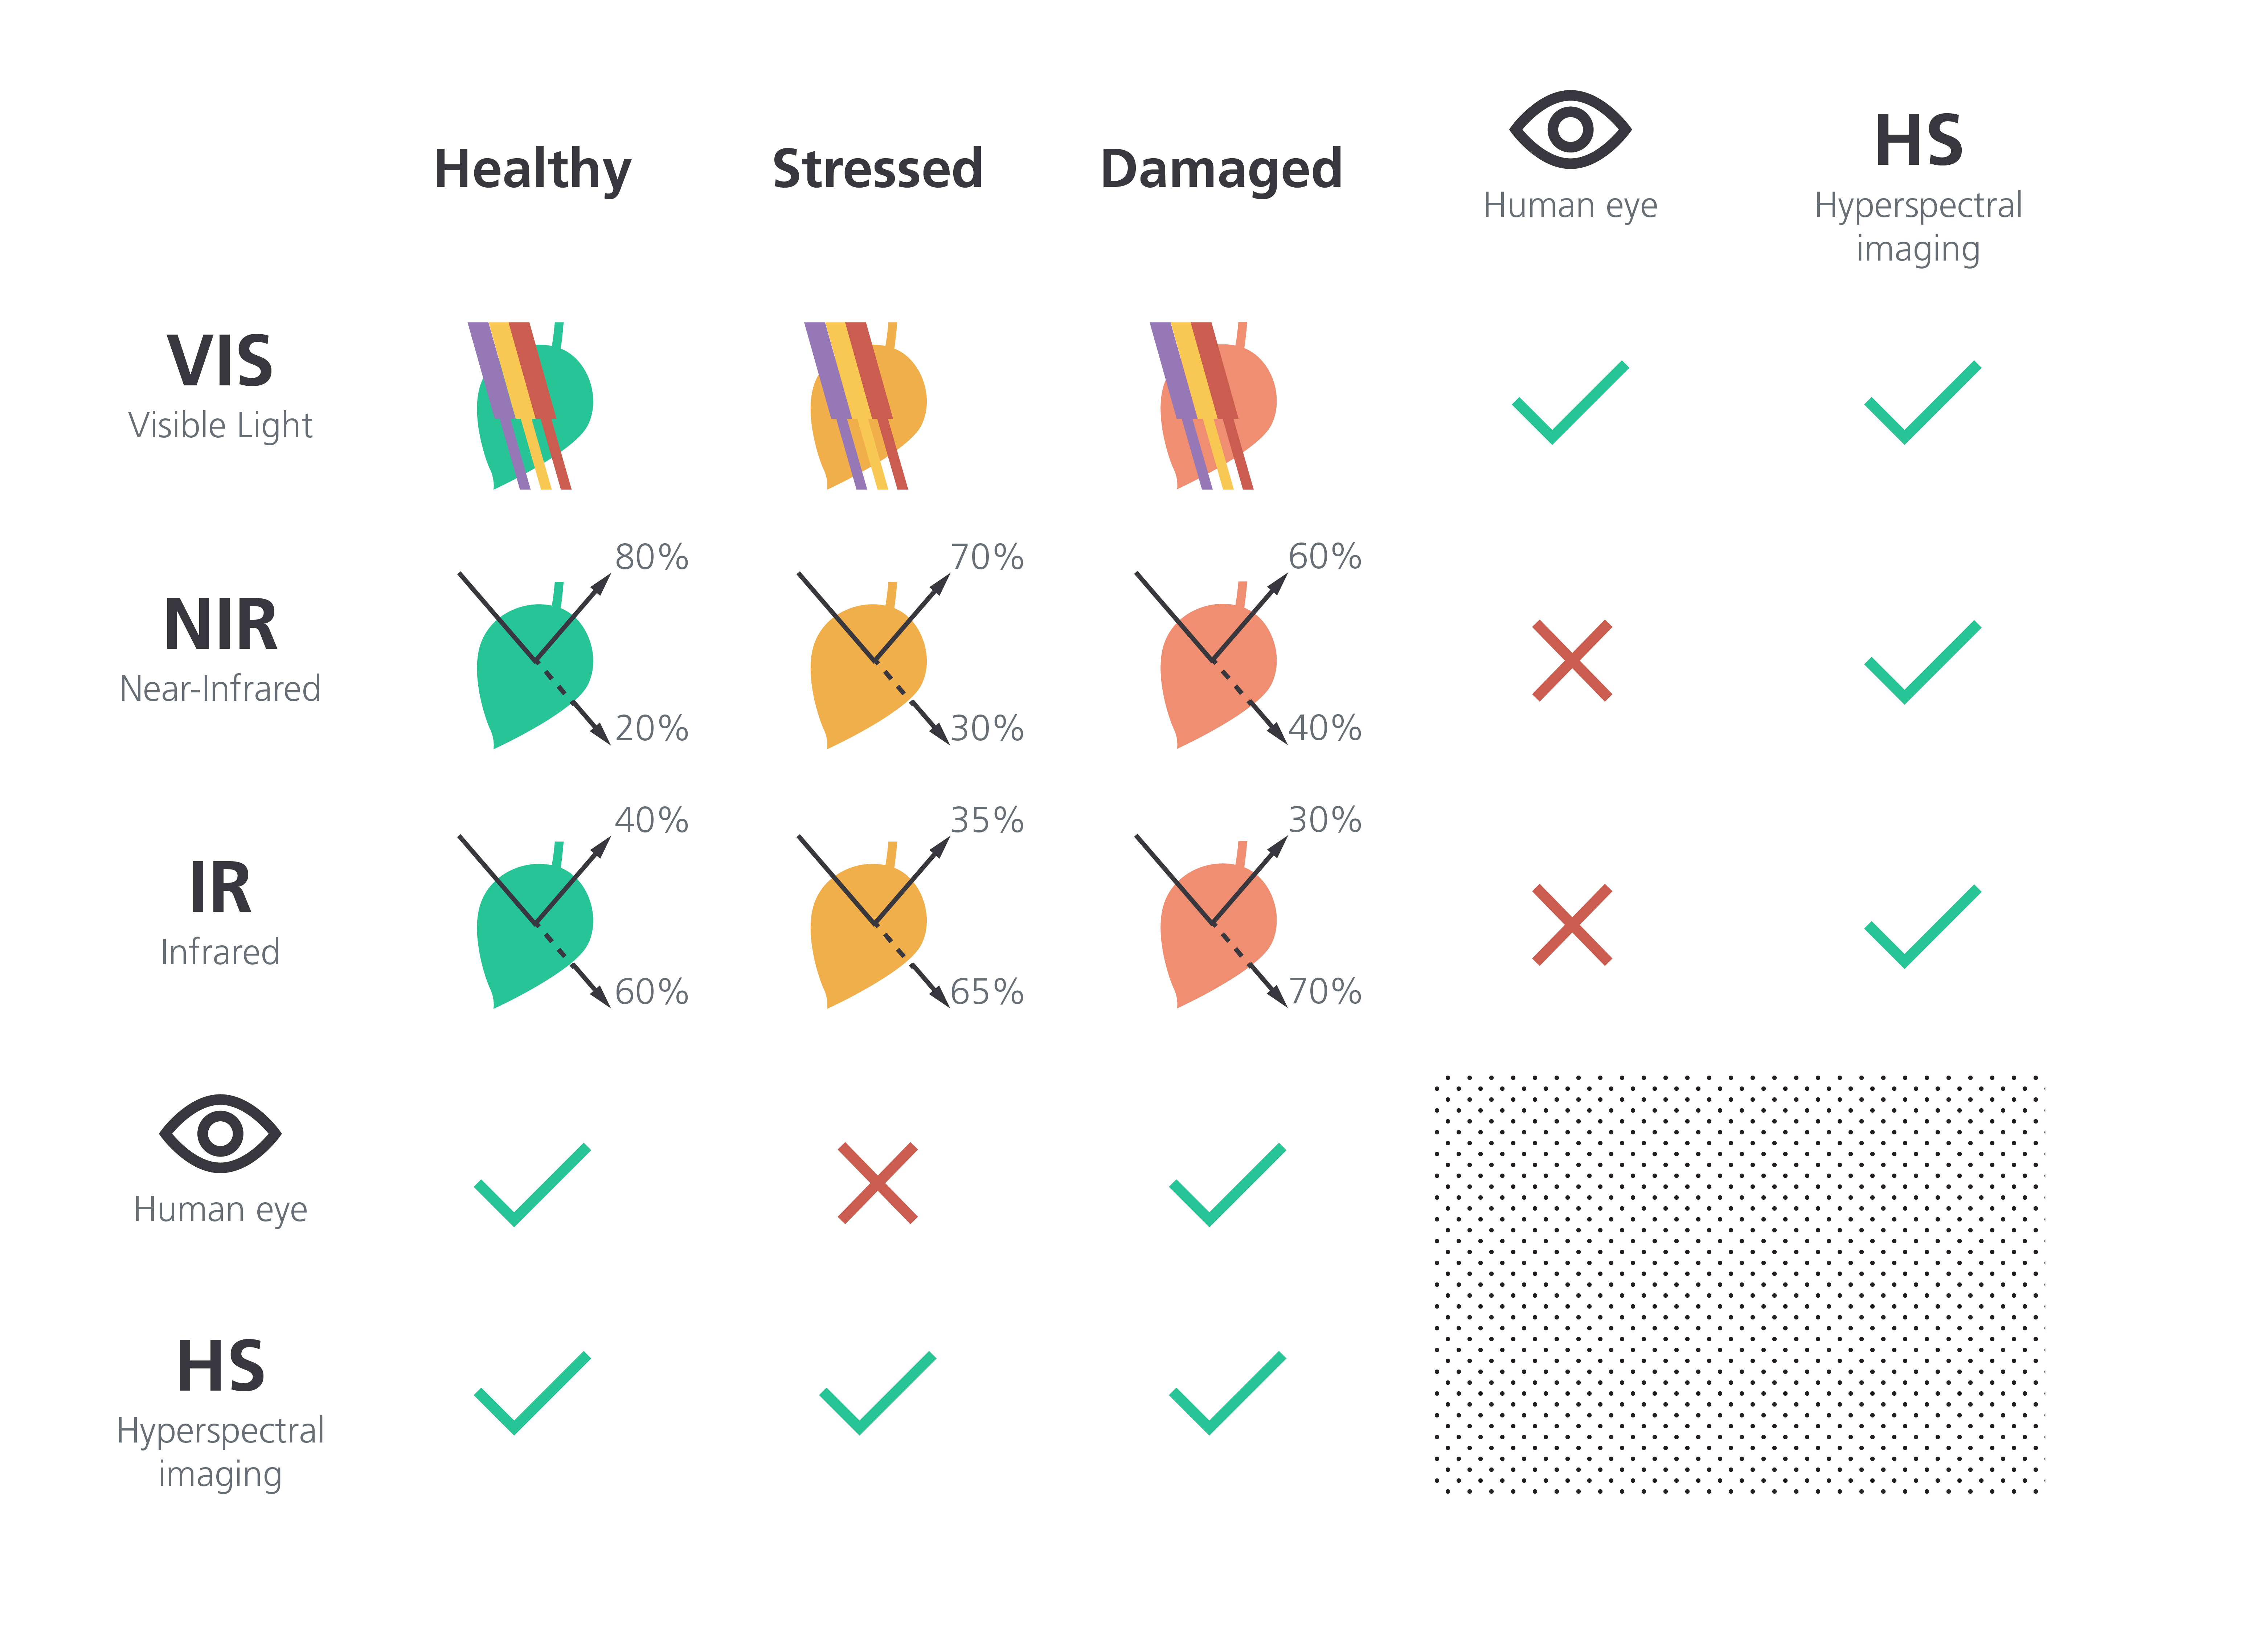
The human eye is good at telling the difference between a healthy and a damaged plant, but it can’t always identify a stressed plant. For visible wavelengths, most light is absorbed aside from green, but that absorption changes depending on a plant’s health. For the NIR and IR images, the solid arrows in the figure indicate reflected light, and the dotted lines indicate transmitted light. Because hyperspectral imagers see beyond the visible light range, they can identify stressed plants early. The reflectivity/transmission values are examples, and in reality will depend on crop species, type of stress, and observation wavelength.
Managing Plant Stress Early: Filling the gap of what we can’t see
Humans are really good at spotting the differences between a healthy plant and a damaged one. Skilled growers build up a depth of expertise and experience in detecting changes that indicate when a plant’s on its last leaves, so to speak. However, humans aren’t as good at spotting the differences between a healthy plant and a lightly stressed plant. The visual cues are subtle and may not be in the visible range.
Here is where hyperspectral imaging really comes into play. It gives us plant signatures in the near-infrared and beyond, outside of what our eyes can detect. Hyperspectral imagers can differentiate between healthy, stressed and damaged plants, as shown in Figure 3.
Hyperspectral imaging empowers early stress detection so growers can react to unfavourable conditions and optimize growth outcomes. If you only react once you see a damaged plant, you’ve arguably lost considerable yield, and it’s uncertain whether or not the plant will fully recover. Through recognizable plant-stress signatures, growers can make rapid corrections to approach optimal growth.
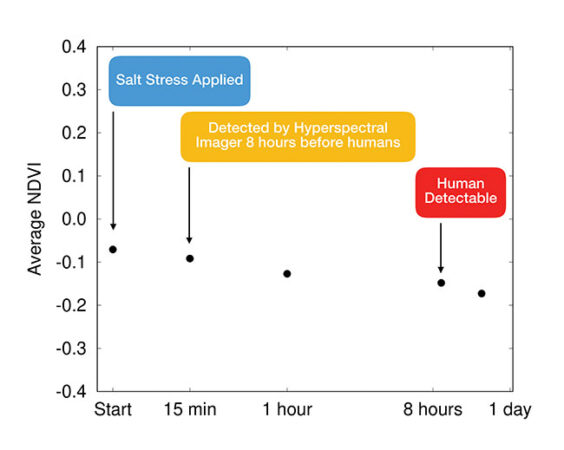
FIGURE 4
Salt stress in Arabidopsis thaliana seedlings was detectable using a hyperspectral NDVI within 15 minutes as compared to 8 hours for the human eye (generated using data from Beisel et al., 2018).
An example of hyperspectral imaging
One of the challenges with hyperspectral imaging is its vast amount of measured data. Scientists reduce the complexity using ‘vegetation indices’ which focus on key parts of the hypercube to bring important information to the surface. One common hyperspectral imaging index class is called normalized difference vegetation index, or NDVI, which measures the relative reflectance of near-infrared light [Beisel et al., 2018]. A group of researchers was able to demonstrate early detection of salt stress in a plant within 15 minutes, when it was only visible 8 hours later by the human eye [Beisel et al., 2018].
There are many more examples of hyperspectral imaging’s power to inform crop growth, and scientists are only scratching the surface of what’s possible.
How Will Hyperspectral Imaging Develop in the Future?
Just as your phone and computer get faster every year, cameras and detectors continue to get cheaper and better. What once was too expensive for anywhere but space is now routinely used for field agriculture. We are seeing the beginnings of more cost-effective monitoring, detection, and analysis of plants through hyperspectral imaging, and soon it will become more readily available in greenhouses. Researchers and companies are building out the technologies and algorithms to bring many of the mentioned capabilities into greenhouses in a more cost-effective way.
There’s a broad, collaborative effort to expand humanity’s perspective beyond what we observe with our eyes so we can see from a plant’s point of view. As we learn more from and about this perspective, we glimpse the dawn of a colourful future for agriculture.
References
- J. S. Boyer, “Plant productivity and environment.,” Science, vol. 218, no. 4571, pp. 443–448, Oct. 1982, doi: 10.1126/science.218.4571.443.
- W. E. Riedell and T. M. Blackmer, “Leaf reflectance spectra of cereal aphid-damaged wheat,” Crop Sci., vol. 39, no. 6, pp. 1835–1840, 1999, doi: 10.2135/cropsci1999.3961835x.
- D. J. Mulla, “Twenty five years of remote sensing in precision agriculture: Key advances and remaining knowledge gaps,” Biosyst. Eng., vol. 114, no. 4, pp. 358–371, 2013, doi: https://doi.org/10.1016/j.biosystemseng.2012.08.009.
- Y. Peng et al., “Identification of the best hyperspectral indices in estimating plant species richness in sandy grasslands,” Remote Sens., vol. 11, no. 5, 2019, doi: 10.3390/rs11050588.
- A. V. Zubler and J. Y. Yoon, “Proximal Methods for Plant Stress Detection Using Optical Sensors and Machine Learning,” Biosensors, vol. 10, no. 12, 2020, doi: 10.3390/bios10120193.
- G. A. Blackburn, “Hyperspectral remote sensing of plant pigments,” J. Exp. Bot., vol. 58, no. 4, pp. 855–867, 2007, doi: 10.1093/jxb/erl123.
- Y. Guan, S. Guo, J. Liu, and X. Zhang, “Algorithms for the Estimation of the Concentrations of Chlorophyll A and Carotenoids in Rice Leaves from Airborne Hyperspectral Data,” in Computational Science — ICCS 2005, 2005, pp. 908–915.
- C. D. Elvidge, “Visible and near infrared reflectance characteristics of dry plant materials,” Int. J. Remote Sens., vol. 11, no. 10, pp. 1775–1795, Oct. 1990, doi: 10.1080/01431169008955129.
- H. R. Xu, Y. B. Ying, X. P. Fu, and S. P. Zhu, “Near-infrared Spectroscopy in detecting Leaf Miner Damage on Tomato Leaf,” Biosyst. Eng., vol. 96, no. 4, pp. 447–454, 2007, doi: 10.1016/j.biosystemseng.2007.01.008.
- N. S. Beisel, J. B. Callaham, N. J. Sng, D. J. Taylor, A. L. Paul, and R. J. Ferl, “Utilization of single-image normalized difference vegetation index (SI-NDVI) for early plant stress detection,” Appl. Plant Sci., vol. 6, no. 10, pp. 1–10, 2018, doi: 10.1002/aps3.1186.
Michael Taschuk, PhD, P.Eng, is founder and CTO; Nicholas Kalogirou, P.Eng, is the AI product manager; and Hal Friesen, M.Sc, is the R&D team lead and technical communications specialist at G2V Optics based in Edmonton, Alta. G2V supplies commercially available lighting and monitoring products for a range of renewable energy, aerospace, and controlled-environment agriculture applications. They can be reached at info@g2voptics.com.
Print this page