Features
Business
Trends
Survey Reflecting Rising Grower Confidence
Many are eyeing price increases and more than half are looking to invest in their facilities
April 15, 2015 By Dave Harrison
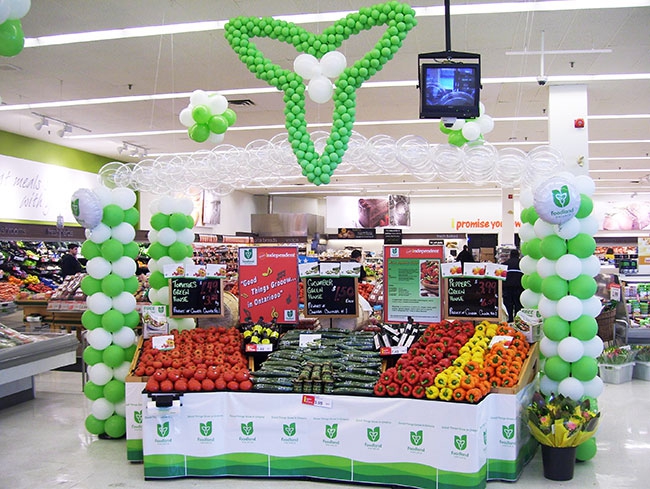
 Stores are enthusiastic about the growing “Buy Local” movement. This is a winner from this year’s Foodland Ontario Retailer Awards program. Photo courtesy OMAFRA
May 2015 – There’s a lot of confidence in the industry, according to our 2015 Grower Survey. Profits are higher and prices are rising.
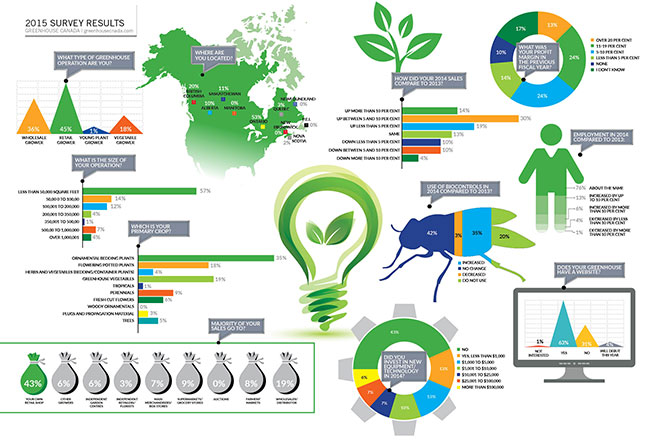
It was another strong year for growers in our survey, with 64 per cent pointing to improved sales compared to 2013, including 30 per cent who reported gains of between five and 10 per cent.
(All numbers are rounded off in this report.)
Growers are quite confident with their pricing plans for 2015, compared to last year’s survey. Some 68 per cent are increasing prices this year compared to 56 per cent last year. Thirty-nine per cent are planning price hikes of up to five per cent this year, compared to 21 per cent planning the same level of increase last year. Twenty-two per cent are hiking prices by between five and nine per cent this year, compared to 29 per cent making the same adjustment last year, while seven per cent have set prices more than 10 cents higher this year, compared to six per cent with the same increases in 2014.
As for sales forecasts for this year, the growers in our survey are not quite as confident in major gains as they were last year. This year:
- 23 per cent are anticipating increases of more than 10 per cent, compared to 27 per cent
- last year.
- 33 per cent are eyeing increases of 10 per cent of less, compared to 39 per cent last year.
- 44 per cent are looking at no gains this year, compared to 31 per cent last year. (No one was forecasting reduced sales this year, compared to three per cent who did last year.)
On the question, “which input cost rose the most in 2014 compared to 2013,” heating topped the survey by 29 per cent of respondents (compared to 19 per cent in last year’s survey). Other leading increases, with 2013 results in brackets, include “labour” at 18 per cent (24); electricity by 16 per cent (15).
Natural gas remains the most popular fuel with 55 per cent (50), followed by propane with 13 per cent (14), wood with 10 per cent (nine), oil with eight per cent (10), and renewables with five per cent (three). Some nine per cent of respondents have no heating system (11).
Some 80 per cent of growers are not anticipating any increase in staffing this year, while 14 per cent are expecting payroll numbers to rise by up to 10 per cent. About three per cent will be increasing employment levels by more than 10 per cent.
There was a little less investment (by the number of growers) in new equipment/technology in 2014 compared to 2013.
- 43 per cent didn’t invest (36).
- 13 per cent, less than $1,000.
- 13 per cent, $1,001 to $5,000.
- 10 per cent, $5,001 to $10,000.
- Seven per cent, $10,001 to $25,000.
- Seven per cent, $25,001 to $100,000.
- Six per cent, more than $100,001.
On the question of investment plans for 2015 (with numbers from last year in brackets), 42 per cent have no plans at present (41). Thirteen per cent of respondents were planning to invest up to $1,000 (eight), the same percentage that will be investing between $1,001 and $5,000 (15). Another 13 per cent are planning to spend between $5,001 and $10,000 (10). About nine per cent will be investing between $25,001 and $100,000 (10), while seven per cent have budgets of between $10,001 and $25,000 (13). Three per cent are spending more than $100,000, the same percentage we saw in last year’s survey.
On the question of “business threats within the coming three to five years,” the ranking was as following, beginning at the top and with last year’s rankings in brackets:
- Taxes/regulations (3).
- Energy costs (1).
- Markets/prices (2).
- Currency fluctuations (5).
- Imported competition (4).
- Labour shortages (6).
Here’s how our respondents viewed each specific threat:
- Taxes/regulations (property, payroll, environmental, permits, etc.): somewhat of a threat, 46 per cent; very much a threat, 38; and not at all, 15.
- Energy costs: somewhat (52); very (30); and not at all (19).
- Market/prices: somewhat (62); very (23); and not at all (15).
- Currency fluctuations: somewhat (46); very (20); and not at all (34).
- Imported competition: somewhat (44); very (14); and not at all (42).
- Labour shortages: somewhat (34); very (19); and not at all (47).
We received a wide range of comments from respondents.
“We’re getting older and have no one who is interested in carrying on the business. We’re hoping to keep it going for another 10 years, but our health will determine whether that’s possible.”
“The cost of fuel. It represents 20 per cent of our expenses.”
“Big box competition.”
“No one to follow up to continue the business.”
“It’s difficult for smaller growers to purchase supplies in smaller amounts.”
“The weather can dampen consumer enthusiasm.”
“Red tape is blocking future expansion.”
“Fewer gardens and gardeners.”
“The whole issue of water, including its acquisition, the disposal of post-irrigation water, and rain water collection.”
“We are a discretionary household expense. The average family has more choices but less money to spend. Keeping floral purchases popular will be a challenge.”
“The challenge in our area is that there were once three greenhouses around us and all have closed. We do not want to get bigger, nor hire more people. We are happy with the size we are. We believe that being the only greenhouse around here will put a lot of pressure on us to produce more, to have more availability.”
“Management is aging, and the business is growing to the point where a new management structure is needed.”
“Being a small grower and not getting volume breaks.”
“Competitors not raising their prices and an oversupply of perennials into the wholesale market.”
“Lack of public awareness surrounding ethical plant selections.”
“Dependent on new housing market fluctuations to see ornamental trees.”
“Identifying under-supplied niche items to bring to market…allowing outside products to flood currently supplied markets.”
“What will happen with the rising minimum wage?”
“Winter sales.”
Here’s how growers ranked business opportunities in the coming three to five years, with rankings from our last survey in brackets.
- Buy Local movement (1).
- Organic or Green Products (3).
- Non-Traditional Products (2).
- Export Markets (4).
And here’s a closer look at their responses for each option:
“Buy Local” was seen as “somewhat” of an opportunity by 48 per cent, while 38 per cent found the concept “very much” an opportunity. Fourteen per cent don’t see much opportunity at all.
Fifty-eight per cent find “Organic or Green Products” to be “somewhat” of an opportunity, while 22 per cent are not too impressed. Twenty per cent find them “very much” a growing opportunity.
With “Non-Traditional Markets,” 48 per cent said they are “somewhat” of an opportunity, while 30 per cent said they were not at all an opportunity. Twenty-two per cent said they were “very much” worth tackling.
It was largely a big thumbs down for “Export Markets,” as 71 per cent said they don’t see them as an opportunity. However, 24 per cent did say they were “somewhat” impressed with their potential. Only five per cent are “very” keen on expanding into exports.
Here’s a sampling of responses from growers assessing potential opportunities:
“Perhaps more farmgate sales.”
“We are a retail greenhouse, so additional areas of growth are in non-horticultural areas.”
“Buy Local. We’re one of the few growers in the Muskoka Region.”
“More retail via the Internet.”
“Container gardening.”
“We are a comfortable family business and don’t want to grow any larger.”
“Expanding the market season to include the Christmas market.”
“Staying ahead of everyone else with new products, or the same product in different sizes and in full colour later in the season (such as July, August and September).”
PEST PRESSURES
Looking back at pest pressures in 2014, here are our growers’ experiences, with responses from last year’s survey in brackets:
Early-season (January through March): “about the same,” 67 per cent (78); “worse,” 18 per cent (10); and “not as bad,” 15 (13).
Spring (April through June): “about the same,” 63 per cent (63); “worse,” 12 per cent (16); and “not as bad,” 25 (21).
Summer (July through September): “about the same,” 63 per cent (71); “worse,” 14 per cent (13); and “not as bad,” 23 (15).
Autumn (October through December): “about the same,” 66 per cent (70); “worse,” 12 per cent (13); and “not as bad,” 22 (17).
DISEASE PROBLEMS
And here’s what our survey recorded about disease pressures.
Early-season (January through March): “about the same,” 81 per cent (87); “worse,” three per cent (three); and “not as bad,” 16 (10).
Spring season (April through June): “about the same,” 73 per cent (83); “worse,” three per cent (six); and “not as bad,” 24 (11).
Summer (July through September): “about the same,” 68 per cent (79); “worse,” 10 per cent (six); and “not as bad,” 22 (15).
Autumn (October through December): “about the same,” 76 per cent (80); “worse,” eight per cent (six); and “not as bad,” 16 (14).

Print this page

