Features
Nutrient management during the flowering phase of drug-type Cannabis sativa
Identifying the plant nutrient uptake under different N concentrations and evaluating the impact of P and K supply.
December 20, 2022 By Martine Dorais, Camille Leblanc, Thi Thuy An Nguyen and Annie Brégard
 To determine the nutrient requirement of drug-type cannabis during the flowering phase, studies were undertaken at the commercial site of IsoCanMed Inc. in Louiseville, Que.
 During the last few years, an increasing number of studies have evaluated the impact of the mineral nutrition on growth, flower yield and cannabinoid and terpenoid profiles of cannabis. As a result, scientific-based N, P and K optimal ranges have been proposed. However, little is now about the nutrient uptake of cannabis during its development.
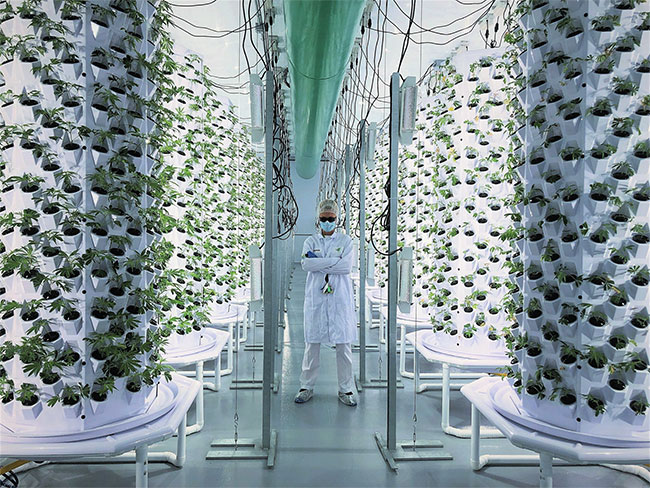
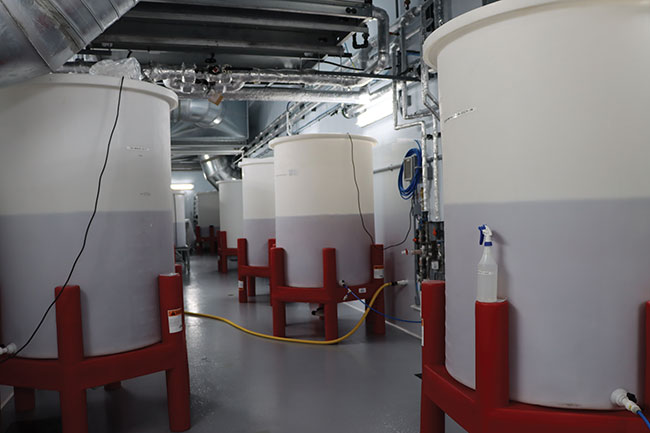
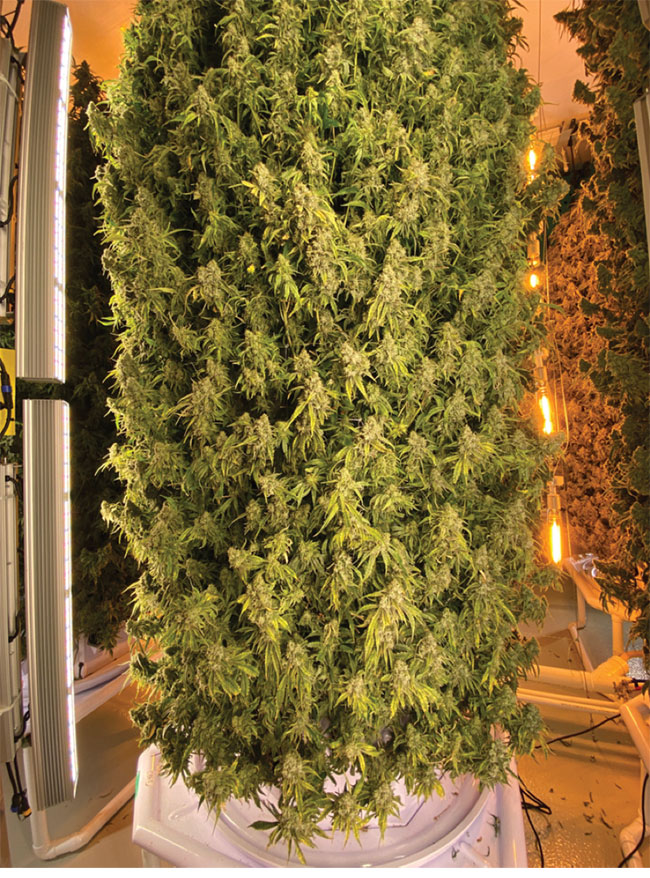
To determine the nutrient requirement of drug-type cannabis during the flowering phase, we studied at the commercial site (IsoCanMed Inc., Louiseville, Que.) the impact of two N concentrations (150 and 250 ppm) on plant growth development, plant nutrient uptake of N, P, K, Ca and Mg, flower yield and their cannabinoid and terpene content. Six growth cycles were performed in a vertical indoor aeroponic growing system with two high THC genotypes (Critical Orange Punch, COP, and White Shark, WS) (figures 1A-D). The plantlets were transferred into a flowering room having 42 vertical aeroponic towers (264 plants per tower; total of 12,672 plants per growth cycle) and submitted to a vegetative phase (16-h photoperiod) of two weeks or directly submitted to the flowering phase (12-h photoperiod; PPFD of 445 µmol m-2 s-1 provided by 1000 W HPS and 315 W LEC lamps; 500-1500 ppm CO2; day/night temperature of 22/18oC; 55-70% RH). Plants were irrigated with a complete nutrient solution, which was collected into a 2,000 L reservoir and reused. Twice a day, the nutrient solution was adjusted for the EC and pH, and the plant nutrient consumption was measured daily (samples taken before and after the nutrient solution adjustment). The nutrient solution was renewed weekly.
A greenhouse experiment conducted at Laval University was also conducted to examine within a randomized complete block design with four replicates the response of one genotype (WS) grown in deep-water culture system of 40 L having three plants per system (total of 40 systems and 120 plants) with five P (25, 50, 100, 150 and 200 ppm) and two K concentrations (175 and 250 ppm) (figure 1E). Upon their transplantation, the plantlets were submitted into the flowering phase with a 12-h photoperiod supplied with 1000 W HPS providing a PPFD of 321 µmol m-2 s-1 at the plant level; 22/18oC day/night temperatures and 63% RH. The nutrient solution was renewed every two weeks or every week.
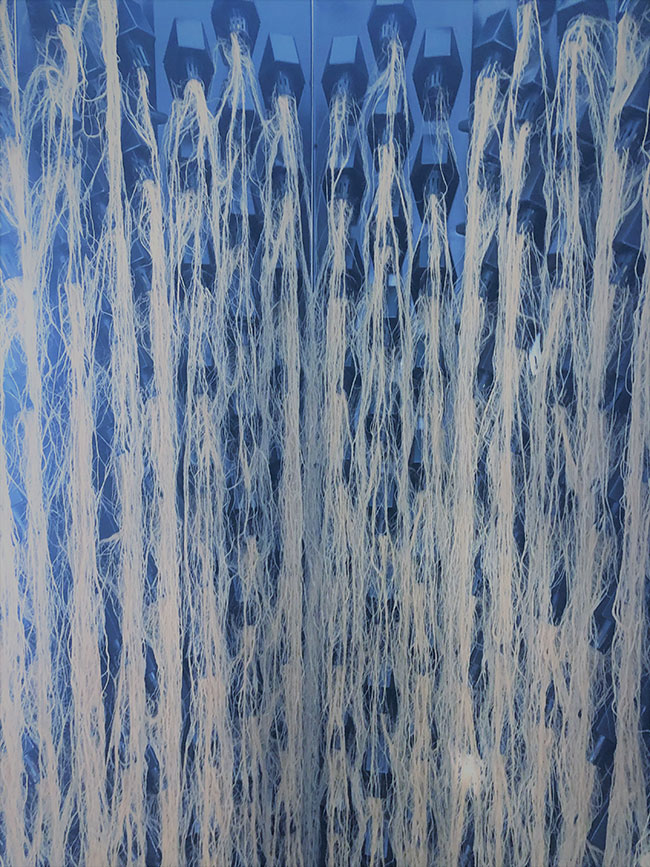
A – Experimental designs at IsoCanMed (Louiseville, Que.) for the N experimental growth cycles (A-D) and Laval University for the N x P experiment (E).
B
D
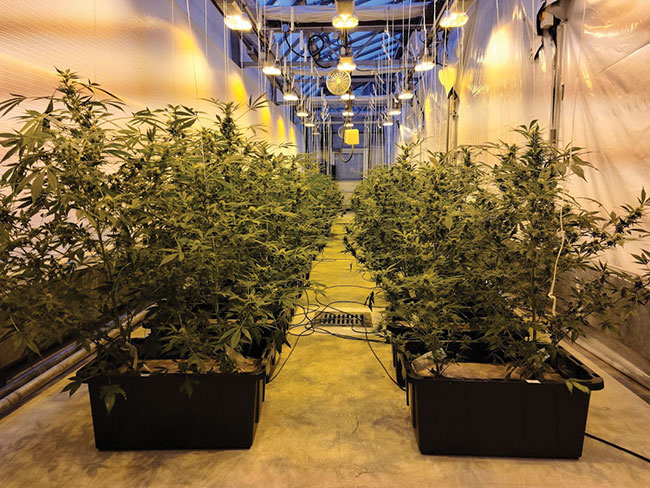
E – Photos: IsoCanMed and Camille Leblanc
Nitrogen effect
During the six growing cycles, the pH and EC of the nutrient solution ranged from 5.74 to 6.02 (average of 5.79 for 250 ppm N and 5.97 for 150 ppm N treatments) and 1.28 to 2.94 mS/cm (average of 2.29 mS/cm for 250 ppm N and 1.93 mS/cm for 150 ppm N treatments) , respectively, while the daily plant water uptake ranged from 100 (150 ppm N) to 111 (250 ppm N) mL per plant.
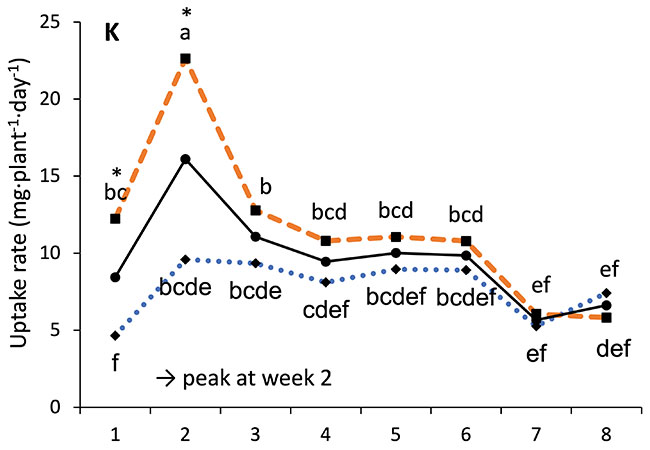
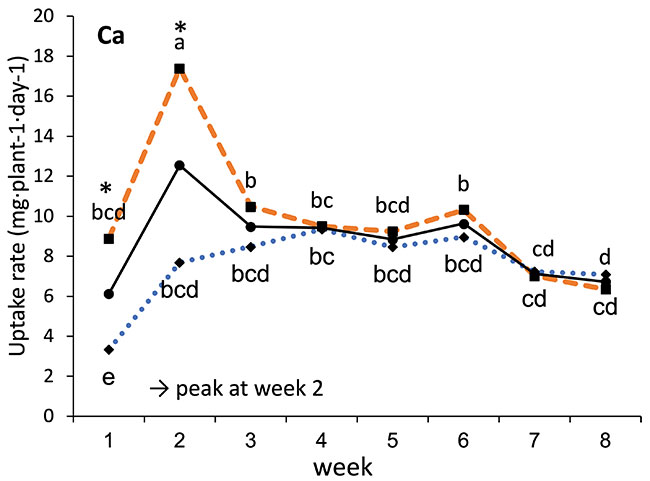
Our results showed that N, K and Ca uptake increased at the beginning of the flowering phase and then decreased, while P and Mg demand increased and then remained constant (figure 2). High N concentration increased N, K and Ca uptake only at week 2 of development, with no effect afterwards. P uptake increased until week 5 and then reached a plateau. This corresponds at the time that flower buds were rapidly growing and gained weight. The reduction of the leaf P content at weeks 4-5 (data not shown) and the increase of the plant P uptake both suggest that flowers constitute a sink for P, with an averaged of 1.3% P content. The K leaf accumulation decreased at week 3, which can be related to the plant K uptake decrease, while Ca leaf content slightly increased during plant development as it is an important structural component for the cells (data not shown). The leaf Mg content of COP decreased after 8 weeks, while its content gradually increased for the WS until week 5, and then decreased, which suggest a genotype specificity (data not shown).
The genotypes, N treatments and weeks had a significant impact on the plant height and the number of nodes per plant (figure 3). Plants reached their maximum height at week 4, except for WS grown at 250 ppm N, which was delayed by one week. N treatment had a strong impact on the height as plants were 1.5 times taller under high N level. From weeks 5 to 10, there was a significant difference between WS and COP grown at 250 ppm for the plant height and the number of nodes per plant.
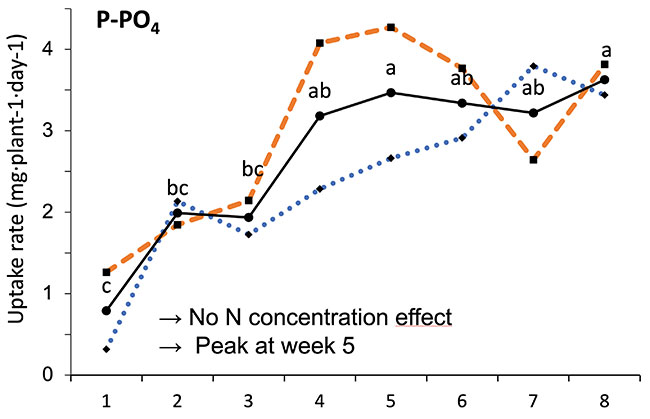
FIGURE 2 Evolution of the averaged daily N-NO3, P-PO4, K, Ca and Mg uptake per plant of C. sativa grown under 150 and 250 ppm N concentrations during the flowering phase.
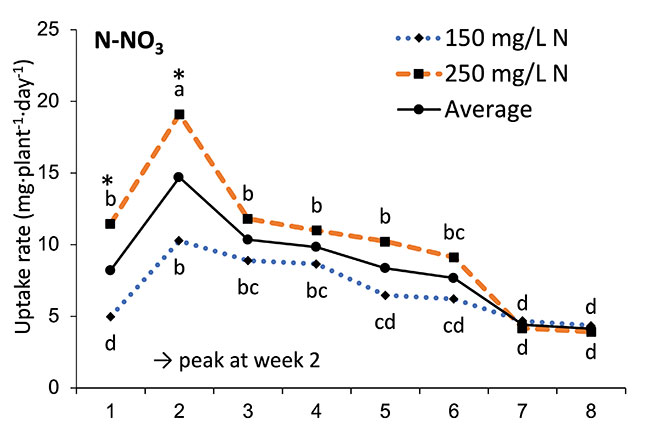
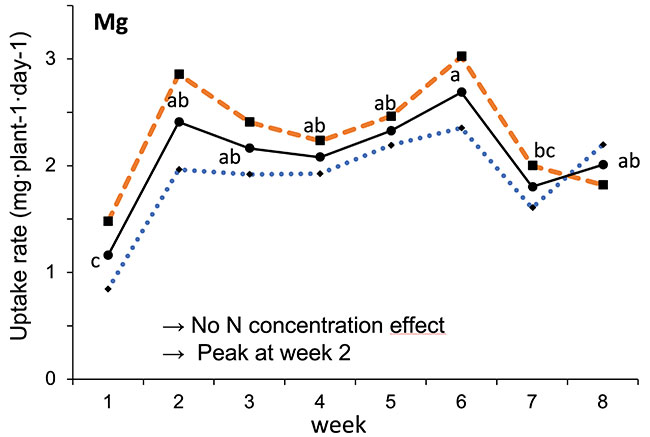
Different letters above the means represent significant differences between treatments by LSD protected by Fisher (P < 0.05). * is indicated when significant different at P≤0.05 between 150 and 250 ppm. (Note : mg L-1 = ppm)
The high N concentration (250 ppm) did not impact significantly the flower yield of COP (average of 4.24 dry g per plant) but increased the yield of WS by 29% (4.50 dry g per plant) compared with the low N concentration (150 ppm; 3.50 dry g per plant). Under 150 ppm N, the flower yield of COP was 27% higher than WS, while no difference was observed under 250 ppm N. However, increasing the N concentration from 150 to 250 ppm N decreased by 9.5% the total THC content of both genotypes (from 17.66% to 16.13). The concentration of THCA already decarboxylated into Δ 9-THC in the dried flowers was, nonetheless, higher under 250 ppm N (0.31% compared with 0.14%). No significant effect of N on the other cannabinoids (CBDA, CBD, CBDV, CBN, CBG, CBGA and CBC) was observed. WS had 1.5 fold more CBN than COP (0.36% compared with 0.24%). Regardless of N concentration, the total THC and CBD potency were similar within both genotypes (16.89% and 0.14%, respectively).
The principal component analysis (Figure 4) shows that different terpenes are related to a specific genotype when grown under a high N concentration (two difference clusters indicated in bleu dotted line for WS and orange dotted line for COP), while other terpenes are related to both genotypes under a low N concentration (same cluster indicated in black line). For example, the high N concentration for WS was related to a high flower content of β-pinene, Trans-β-ocimene, carene, isoterpinolen, pseudolimonen, E-nerolidol, caryophyllene and β-myrcene, while a high N concentration for COP was related to caryophyllene oxide, linalool, β-eudesmol, humulene, D-limonene, o-cymene and cis-β-ocimene. On the other hand, a low N concentration for both genotypes was related to α-pinene, trans-nerolidol, I-bomeol, L-α-terpineo, guaiol and phytol.
Regarding the impact of K and P concentrations, no significant effect was observed on plant growth parameters (average values: total plant biomass of 160.5 g dw/plant; leaf biomass of 105 g dw/plant; root biomass of 11.5 g dw/plant; growth index of 1673; shoot diameter of 13.2 cm; number of leaves per plants of 292; chlorophyll content index of 61.8; and maximum quantum yield of photosystem II of 0.82), flower yield (27.9 g/plant) and water use efficiency (1.28 g/L), except for leaf area where the higher K concentration (250 ppm), regardless of the P concentrations, increased its value by 1.6 times compared with the 175 ppm K treatment (11,015 cm3/plant vs 6,878 cm3/plant).
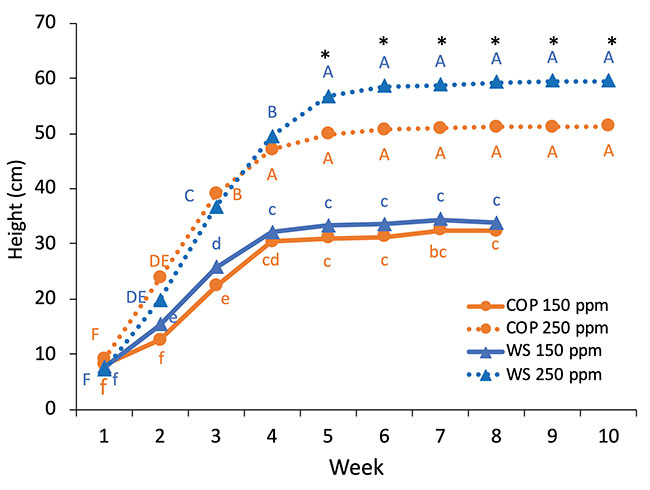
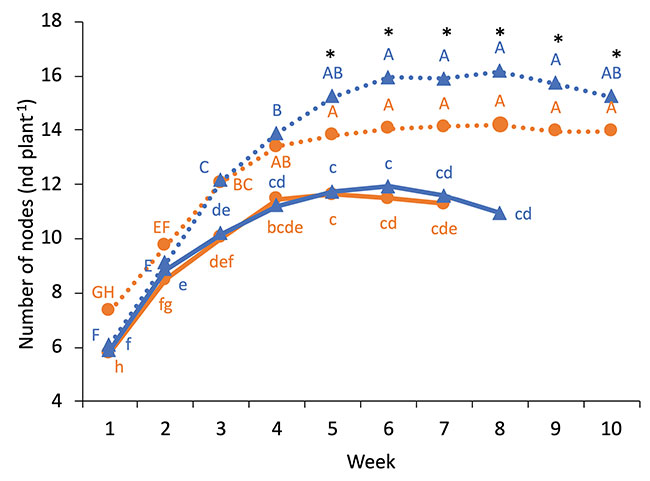
FIGURE 3
Weekly evolution of plant height and the number of nodes of WS and COP grown under 150 ppm N-NO3 (plain line) and 250 ppm N-NO3 (dotted line). Different lowercase letters above the means represent significant differences between the weeks and genotypes grown under 150 ppm N-NO3 by protected Fisher’s LSD test (P<0.05), while uppercase letters indicate differences for plants grown under 250 ppm N-NO3
*indicates a significant difference between the two cultivars at 250 ppm N-NO3. (Note : mg L-1 = ppm)
After 80 days of growth, N and K leaf content decreased compared with their content at 25 days, while Ca and Mg increased (data not shown). On the other hand, the N and P concentrations in the flowers increased, which suggest that flowers may constitute a sink for N and P due to the high energy demand for the biosynthesis of cannabinoids and terpenes. Under moderate P concentrations, the high K concentration (250 ppm) increased the leaf K content compared with 175 ppm K, which may suggest a “luxury consumption” of K. The leaf Ca content at 80 days was 36% higher than its content at 25 days of growth, which might be due to a higher transpiration rate as Ca transportation from the roots to the leaves is highly related to the transpiration stream.
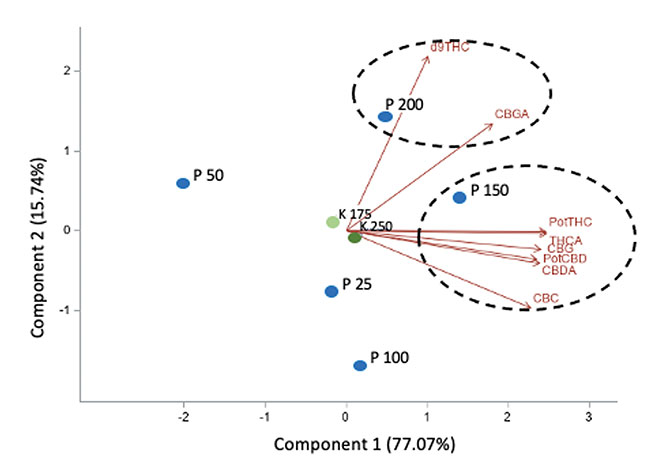
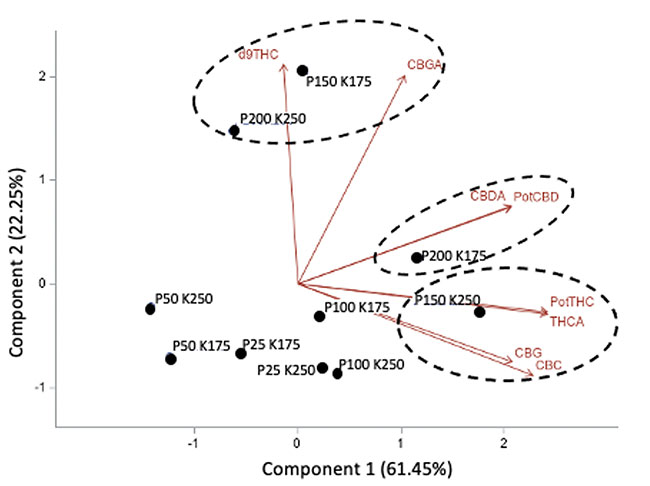
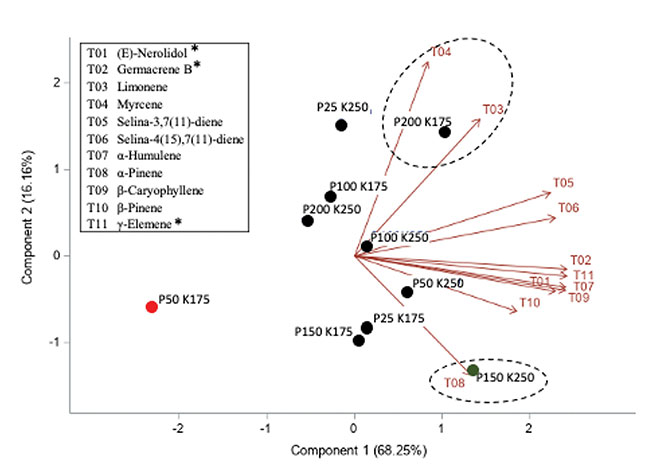
In addition, no significant effect of P and K concentrations on the cannabinoid content (THCA, Δ9-THC, CBDA, CBD, CBGA, CBG, CBC) were observed with 14.08 to 16.24% for total THC and 0.05% for total CBD. The averaged terpene content of the flowers was 19.56 mg g-1; 75% of the terpenes were sesquiterpenes followed by the monoterpenes, while the remaining 1% were diterpenes. From the 60 terpenes identified, 11 terpenes representing 72% of the total terpene content had more than 0.50 mg g-1 and is known as having pharmacological metabolites of interest. β-caryophyllene was the terpene found at the highest concentrations with an averaged value of 2.64 mg g-1 followed by germacrene B, selina-3,7(11)-diene and α-pinene with 2.45, 1.72 and 1.50 mg g-1, respectively. Only three terpenes were impacted significatively by the 50 ppm P x 175 ppm K treatment. Figure 5 shows the relationship between the P and K concentrations and the flower content in cannabinoids (figures 5A and 5B) and terpenoids (figure 5C).
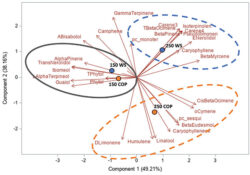
FIGURE 4
Principal component analysis of the terpenoids found in two genotypes (WS and COP) of C. sativa grown under 150 and 250 ppm N. The Principal com-ponent 1 accounted for 49.21% of total variance whereas the Principal Component 2 accounted for 38.16%.
In summary, our N experiments showed that N, K and Ca plant uptake peaked at week 2 and then decreased, while Mg and P uptake increased until weeks 2 and 5, respectively, and stay relatively high throughout the flowering phase. At the beginning of the flowering phase, high N fertilization promoted the N, K and Ca plant uptake. The high N fertilization increased the flower yield of White Shark by 29%, while no effect was observed for Critical Orange Punch. For both genotypes, 250 ppm N fertilization reduced by 9.5% of the total THC content compared with 150 ppm. Therefore, growers may modulate the N supply according to the developmental stage of their genotype to avoid any N overfertilization and overgrown plants. However, further studies are needed to identify the optimal N concentration as neither genotype responded similarly. Regarding our P x K experiment, we did not observe any significant beneficial effect of higher P and K concentrations on flower yield, but we had a 60% higher leaf area under 250 ppm of K compared with 175 ppm, and higher plant biomass at 100 ppm of P and 250 ppm of K, while lower N flower content was observed under 50 and 100 ppm of P and 175 ppm of K. The cannabinoid concentrations in the inflorescences of plants grown in a hydroponic growing system were not significantly affected by the P and K studied concentrations, although total THC was related to high P content (P 150 ppm). Only three main terpenes were affected by P x K fertilization where the 50 P x 175 K ppm treatment reduced their content. High P concentrations (150 or 200 ppm) were related to some terpenes such as pinene, myrcene and limonene.
A
B
C
FIGURE 5
Principal component analysis of the cannabinoids and terpenoids found in the flowers of C. sativa WS grown under 10 combination treatments of P (25, 50, 100, 150, and 200 ppm) x K (175 and 250 ppm). A) Simple effect of P or K on the flower cannabinoid content; B) P x K combined effect on the flower cannabinoid content; C) P x K combined effect on the flower terpenoid content.
Overall, our results suggest that hydroponic cannabis growers do not need to use a concentration above 25 ppm for P and 175 ppm for K as those levels were sufficient for an optimal plant development and yield. However, a high level of P (150 and 200 ppm) was positively related to the cannabinoids and some terpenes as shown in figure 3. These levels may vary according to the genotype and the light growing condition, as our P x K experiment was conducted with only one genotype and under relatively low light conditions. Additional studies with a large number of genotypes and under different growing conditions (e.g. growing media, lighting) are needed to better characterize the impact of the N, K and P management on the cannabinoids and terpene content.
Acknowledgments
The authors thank the Natural Sciences and Engineering Research Council of Canada (NSERC) and IsoCanMed Inc. for the final support for this research. We are also grateful to Nathalie Delisle, Erik Bertacchini and Juliano Bertacchini for their trust and greatly appreciated technical assistance making this study possible as well as Rejean Bacon from Laval University for his support regarding the administrative and scientific aspects.
Complete results could be find at: https://corpus.ulaval.ca/entities/publication/a6217be6-1cce-4f9d-bb5d-042f479dcdc7
Print this page