
You’d think with natural gas prices at their lowest levels in many
years, energy issues would be the least of a grower’s worries.
You’d think with natural gas prices at their lowest levels in many years, energy issues would be the least of a grower’s worries.
 |
|
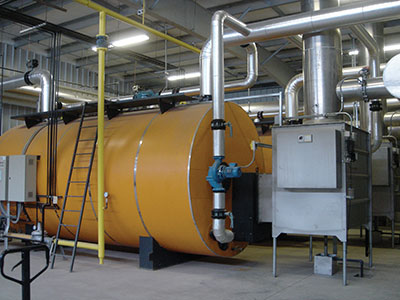
| Energy is still a topic of concern to many growers. Advertisement
|
Think again. Energy indeed remains a concern for many growers, according to our second annual Grower Survey.
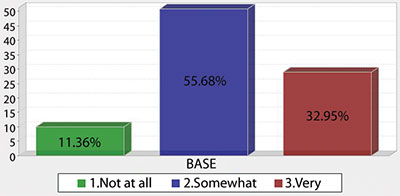
To the question, “How would you rate the following as business threats in the coming year,” and specifically to the “Energy costs” threat, some 56 per cent of respondents said they were “somewhat” concerned, while a further 33 per cent said they were “very” concerned. The remaining 11 per cent said they were “not at all” concerned.
 |
|
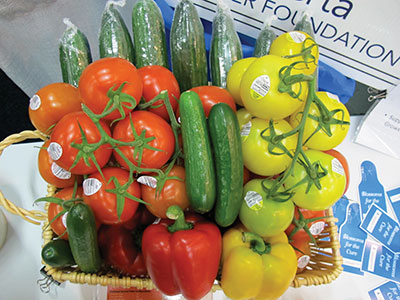
| Some 26 per cent of respondents were vegetable growers
|
Please note that all survey responses have been rounded off in this story.
Overall, the survey reflected a buoyant industry that’s fairly confident in 2013. This year’s results are similar to last year’s survey results. (You can find the 2012 story online in our online archives at www.greenhousecanada.com. Go to “April 2012 in our Past Issues).
Growers are decidedly optimistic in assessing this year’s markets, with some expansion plans being set and price increases in place.
About 102 growers completed the survey, about the same as last year (111).
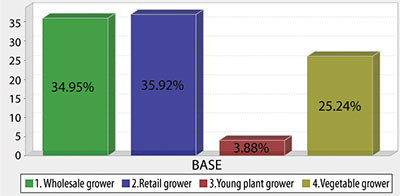 |
WHAT TYPE OF GREENHOUSE OPERATION ARE YOU?
■ With last year’s responses in brackets, 36 per cent (34) of respondents are “retail growers”; 35 per cent (38) are “wholesale growers”; 25 per cent (22) are “vegetable growers”; and four per cent (five) are “young plant growers.”
WHERE ARE YOU LOCATED?
■ Geographically, the regions with the largest percentage representation were Ontario, 51 (58); British Columbia, 18 (14); Alberta, 11 (12), and Manitoba, seven (one). Only about two per cent of respondents were from Quebec this year, down from four per cent last year.
SIZE OF YOUR OPERATION?
■ The majority of respondents – 56 per cent – had greenhouses of about an acre or less, followed by the following size categories: 50,000 to 100,000 square feet – 17 per cent; 100,001 to 200,000 sq. ft. – eight per cent; 200,001 to 350,000 sq. ft. – five per cent; 350,001 to 500,000 sq. ft. – five per cent; 500,001 to one million sq. ft. – five per cent; and those over one million sq. ft. – three per cent.
|
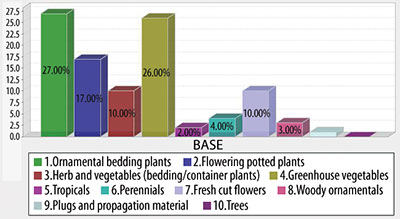
WHAT IS YOUR PRIMARY CROP?
■ Ornamental bedding plants (27 per cent) and vegetables (26) led this category, followed by flowering potted plants (17), bedding plant herbs and vegetables (10), cut flowers (10), and perennials (four). Woody ornamentals (three), tropicals (two) and propagators (one) rounded out the list.
SECONDARY CROPS
■ Among secondary crops listed were bedding/container herbs and vegetables (42), perennials (15), flowering potted plants (15), ornamental bedding plants (nine), greenhouse vegetables (eight), foliage (eight), cut flowers (seven), trees (seven), propagation (four), and woody ornamentals (three).
WHAT IS YOUR ANNUAL SALES VOLUME?
■ On the question of revenues, the largest group of respondents (22 per cent) had sales of $50,000 or less. About 21 per cent had sales of $100,001 to $500,000, while 17 per cent earned between $500,000 and $1 million. About 14 per cent had revenues of between $50,001 and $100,000, and 12 percent range in between one and two millon dollars. Rounding out the list were seven per cent with more than $5 million, six per cent earning between two and three million dollars, and three per cent registering beween three and four million dollars. (Where do you fit in?)
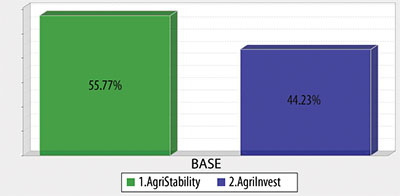 |
This year’s survey differed significantly from last year on the question of support programs. Some 56 per cent of growers participated in AgriStability in 2012, compared to 36 per cent in 2011. There were 44 per cent in the AgriInvest program in 2012, while 64 enrolled in 2011.
HOW DO YOUR 2012 SALES COMPARE TO 2011?
■ It was a much better year at the register or on the ledger for growers in 2012. About 49 per cent enjoyed much better sales last year than in the previous year, while about a quarter had a “stand pat” kind of year. Unfortunately, about 10 per cent had sales down by more than 10 per cent.
WHAT WAS YOUR PROFIT MARGIN IN THE PREVIOUS FISCAL YEAR (2011)?
■ The most worrisome finding with this question was that just shy of 19 per cent of respondents didn’t know their profit margins. However, some 21 per cent had margins of between five and 10 per cent, while 18 per cent enjoyed margins of greater than 20 per cent. Other segments included 16 per cent with 11 to 19 per cent margins; 14 per cent surviving on less than five per cent; and 12 per cent about breaking even.
WHAT WAS YOUR PROFIT MARGIN THREE YEARS AGO?
■ The results were quite similar to the 2011 results, so at the very least there has been some stability in the industry. About 17 per cent didn’t know their margins. The other results were as follows, in order of greatest margins to smallest: over 20 per cent – 16 per cent; 11-19 per cent – 18 per cent; five to 10 per cent – 17 per cent; less than five per cent – 15 per cent; and no profits – 15 per cent.
|
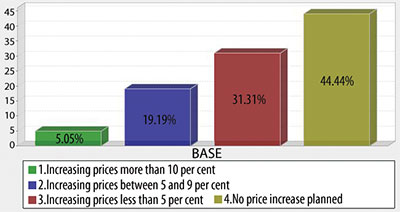
PRICES FOR 2013? OVERALL ARE YOU:
- Increasing prices more than 10 per cent – five per cent.
- Increasing prices between five and nine per cent – 19 per cent.
- Increasing prices less than five per cent – 31 per cent.
- No price increases planned – 44 per cent.
The latter statistic is a little alarming. Without price increases, are growers hoping for significantly increased sales volumes to help keep them in business? With inflation at about two per cent or so, growers have to at least cover those increases. The economy is rebounding, and can handle price hikes, probably in the five per cent range (as the largest group of respondents were planning to do while filling out the survey in January.
WHAT ARE YOUR SALES FORECASTS (VOLUMES) FOR 2013 COMPARED TO 2012?
■ We cheered these results. Perhaps not wildly, but there was a smattering of applause and perhaps a “high five” or two. There’s considerable market confidence.
More than half of respondents anticipate greater volumes being shipped, including 27 per cent eyeing an increase of more than 10 per cent, and 32 per cent confident they’d see increased sales volumes of up to 10 per cent. About a third of respondents said this year would mirror 2012, and the coffee shop consensus was that 2012 was a solid year in terms of volumes. On the other hand, six per cent of growers feel sales will drop by about 10 per cent or less, while one per cent say the drop will be greater than 10 per cent.
THIS SECTION LOOKS AT PEST AND DISEASE PRESSURES FOR 2012
■ As for seasonal pest pressures, we compared the 2012 to 2011 conditions.
- Early season, January through March: worse in 2012 – two per cent; same – 76 per cent; and not as bad as 2011 – 22 per cent.
- Spring, April through June: worse in 2012 – 12 per cent; same – 61 per cent; and not as bad as 2011 – 27 per cent.
- Summer, July through September: worse in 2012 – 19 per cent; same – 60; and not as bad as 2011 – 21 per cent.
- Autumn, October through December: worse in 2012 – six per cent; same – 81; and not as bad as 2011 – 13 per cent.
What about seasonal disease pressures? To refresh your memories, last year’s survey reviewed the year as a whole and found that 27 per cent of growers experienced fewer problems in 2011 compared to 2010, while 12 per cent said it was much worse. The remainder said the two years were about the same.
However, this year we did ask for a seasonal breakdown, similar to the “pest” questions, and asked growers to assess their disease pressures in 2012 compared to 2011.
- Early season, January through March: worse in 2012, one per cent; same, 87 per cent; and not as bad as 2011, 12 per cent.
- Spring, April through June: worse in 2012 – seven per cent; same – 74 per cent; not as bad as 2011 – 19 per cent.
- Summer, July through September: worse in 2012 – 11 per cent; same – 74 per cent; not as bad as 2011 – 15 per cent.
- Autumn, October through December: worse – six per cent; same – 85 per cent; not as bad as 2011 – nine per cent.
WHICH INPUT COST ROSE THE MOST IN 2012 COMPARED TO 2011?
■ Labour costs for 2012 attracted the most attention (37 per cent of respondents), well up from last year’s survey (26 per cent). If there are areas in your greenhouse you can automate, the investment would be well worth it.
Energy was another leading increase for many growers, including electricity (listed by 12 per cent in 2012 compared to 17 per cent in 2011) and heating (11 per cent in 2012 compared to 26 per cent in 2011).
Other leading line item increases included fertilizers (10 per cent), plant material (seven), plant material (three), water (three) and water (three).
PRIMARY HEATING FUELS
■ Natural gas is far and away the fuel of choice for the industry, with 63 per cent of respondents working with it in 2012, compared to 50 per cent in 2011. Others listed in this survey, with 2011 results in brackets, include: oil – nine per cent (14), no heating system – eight per cent (eight); propane – five per cent (five); wood – five per cent (10); other renewables – six (10 per cent).
About three per cent used coal in 2012, about the same as 2011.
EMPLOYMENT IN 2012 COMPARED TO 2011
■ There was some growth overall last year compared to 2011, though the majority of growers (70 per cent) had about the same number of employees year over year. About six per cent of growers increased their workforce by more than 10 per cent, while a further 17 per cent welcomed up to 10 per cent more employees. Cutting back were three per cent of respondents (less than 10 per cent) and four per cent who trimmed more than 10 per cent.
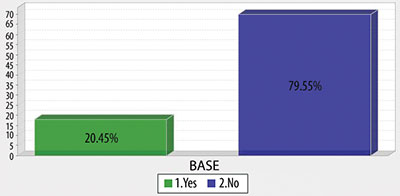 |
DO YOU EMPLOY OFFSHORE WORKERS?
■ Given that the majority of respondents were in the medium to small size range, it’s probably not surprising that only 20 per cent made use of offshore workers in 2012, compared to 24 per cent in 2011.
On the question of percentage of offshore workers, about 80 per cent of respondents had none, seven per cent had less than 25 per cent, six per cent had less than 50 per cent, and nine per cent had more than 50 per cent.
EMPLOYMENT FORECAST FOR 2013 COMPARED TO 2012
■ There will be limited growth in the number of new employees in the greenhouses participating in the survey. About 71 per cent of respondents won’t be hiring this year, while 10 per cent expect to trim their workforce by up to 10 per cent, compared to 15 per cent who will be welcoming new employees. About four per cent will be growing their workforce by more than 10 per cent.
DID YOU EXPAND/BUILD IN 2012?
■ Not much to report here, as 85 per cent of respondents did not expand.
However, there will be more activity this year, as a number of projects are on the books. About 20 per cent will be adding 10,000 sq. ft. or so, and seven per cent will be growing between 10,000 and 25,000 sq. ft. One grower is planning a project of between 25,000 and 50,000 sq. ft, and another is looking at an expansion of more than 100,000 square feet.
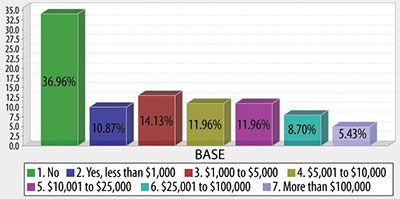
DID YOU INVEST IN NEW EQUIPMENT/TECHNOLOGY IN 2012?
■ Growers may not have been expanding, but they were busy investing in what they have. About three per cent put more than $100,000 of upgrades into their facilities in 2012, while 14 per cent invested between $25,000 and $100,000. Eight per cent spent between $10,000 and $25,000, while 45 per cent spent less than that. Even small improvements can made a huge difference.About 30 per cent, however, did not make upgrades.
 |
DO YOU PLAN TO INVEST IN NEW EQUIPMENT IN 2013?
■ Responses to this question demonstrated the confidence many growers have in the market. Unfortunately, while 37 per cent have no current upgrade plans, five per cent have their chequebooks handy and are ready to spend more than $100,000 on improvements. In other responses
- Nine per cent of respondents will be investing up to $100,000 this year.
- 12 per per cent are spending up to $25,000, while another 12 per cent are eyeing projects of between $5,000 and $10,000.
- 25 per cent have smaller projects in mind.
 |
|
USE OF BIOCONTROLS IN 2012 COMPARED TO 2011
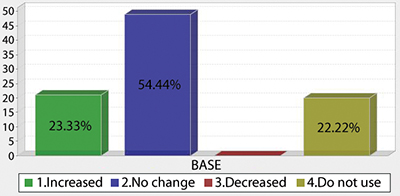
■ While 22 per cent of respondents say they don’t use them, those who do are quite committed. More than half said usage was about the same last year as it was in 2011, while almost one in four growers said they increased usage. Not a single respondent said they decreased their use of biocontrols.
In last year’s survey, based on the 2011 crop year, 42 per cent of respondents said there was no change, while 31 per cent said usage had increased. About eight per cent decreased usage.
Most interesting to note was that some 20 per cent of respondents last year said they didn’t use biocontrols, compared to 22 per cent this year.
 |
DOES YOUR GREENHOUSE HAVE A WEBSITE?
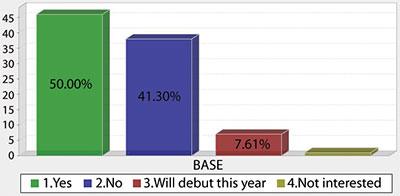
■ Half our respondents said “yes,” while eight per cent will launch their website this year. However, 41 per cent of greenhouses don’t yet host a website. In terms of marketing, and with the rise of social media, this will soon be a major disadvantage for those growers not connected to the web. Our bold prediction is that most, if not all, greenhouses will have websites within five years.
|
ASSESSING BUSINESS THREATS
■ What is it that keeps growers tossing and turning at night, beyond the occasional system alarm at 2:30 a.m.?
We listed several “issues” and asked growers to rate how much of a threat the issues are.
- Hands-down, the biggest worry is with markets and prices, with 53 per cent “very” worried, and 45 per cent “somewhat” worried.
- Imports have the attention of most growers. Some 43 per cent are “very” worried, while 38 per cent are “somewhat” worried.
- Energy fears are a major concern, as 56 per cent are “somewhat” concerned, while 33 per cent are “very” worried.
- Currency fluctuations are clearly a worry, with 57 per cent of respondents saying they’re either “somewhat” or “very” concerned.
- Taxes, regulations and permits, etc., are a worry. About half the respondents are “somewhat” worried, while 40 per cent are “very” concerned.
- Labour shortages are not causing many sleepless nights. About 55 per cent of growers say they’re “not at all” concerned with the issue.
ASSESSING EMERGING OPPORTUNITIES
■ We then turned our attention to new market opportunities.
Growers are clearly shopping around, checking for “non-traditional” products, with 29 per cent saying they are “very” interested, and another 54 per cent “somewhat” interested.
The “Buy Local” movement is quite topical, as almost all respondents were “very” (40 per cent) or “somewhat” (50 per cent) interested.
Most provincial governments are increasingly promoting the concept. The Ontario government, which recently welcomed Kathleen Wynne as its new premier (and Minister of Agriculture and Food!), has announced an expanded “Buy Local” initiative. The “Local Food Act” would help make more local food available in markets, schools, grocery stores and restaurants.
Will more “organic” or “green” products be grown? Yes, though about a quarter of respondents are still “not at all” interested in growing them. About 43 per cent are “somewhat” interested.
Perhaps reflecting the large number of smaller growers in our survey, 55 per cent of growers in the survey have no interest in pursuing export markets, while only 11 per cent will be ramping up their efforts in such sales.
And one final note: those completing the survey had the chance to enter a draw for an iPad Mini. This year’s winner was Geneviève Sauvé of Saint-Jean-sur-Richelieu, Quebec.
Print this page