Features
Environmental Control
Handling Systems
Structures & Equipment
Digital Horticulture: An Essential Step Toward Autonomous Growing
October 6, 2021 By Kenneth Tran and John Chang
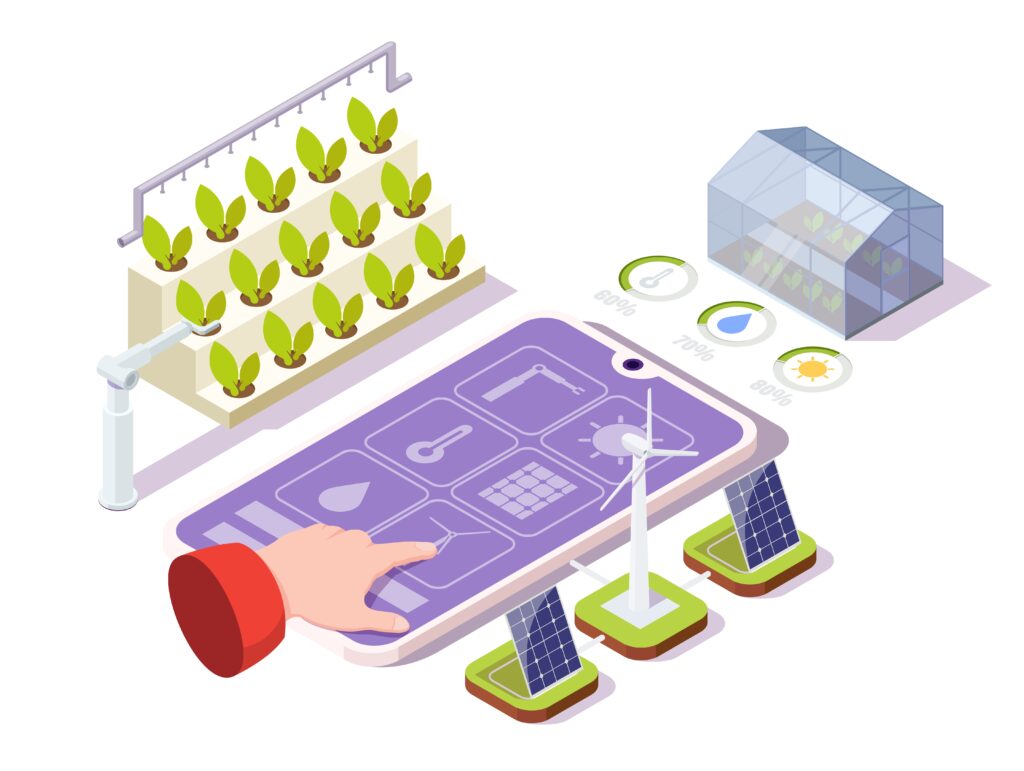 Photo credit: Getty Images
 Through our article titled “A primer on AI and its rise in the greenhouse”, we learned that a well-architected artificial intelligence (AI) system can help growers optimize resource efficiency and achieve higher yields. By uncovering data insights across greenhouse operations, growers can use AI to make more informed decisions, enabling indoor farms to be ultimately more sustainable and profitable.
Unfortunately, amidst the rush to jump on the AI bandwagon, many companies – and even data scientists and machine learning specialists themselves – overlook the need to build a solid foundation for how data is captured, organized, and shared within the organization.
Simply put, in order to use AI and achieve autonomous growing, you need to have a solid foundation in data management and what’s known as information architecture (IA). IA is loosely defined as the structural design of what data to collect and how to ingest data potentially from multiple data sources, preprocess the data, store the data on the cloud, then efficiently retrieve the data in downstream applications.
To use a metaphor, if AI were a rocketship then data is the fuel. The more sophisticated the rocket ship, the greater the need for clean, quality jet fuel. The same goes for AI and data.
Three Steps To Autonomous Growing
To better illustrate the overall journey and to help indoor farms move towards autonomous growing, we have created a technology deployment roadmap. The roadmap consists of three distinct stages, illustrated below (Figure 1)
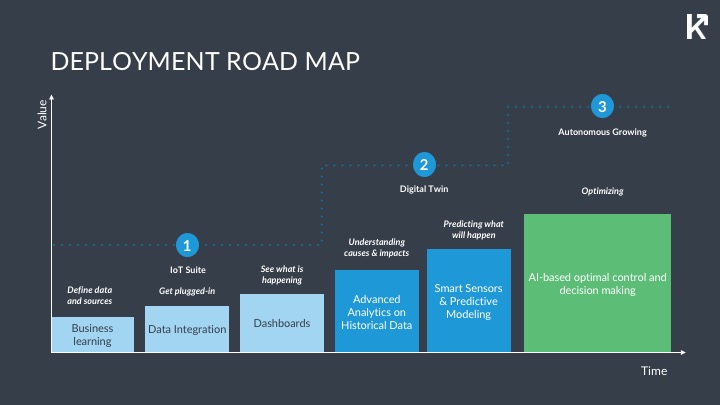
Figure 1: A visualization of a deployment roadmap for an autonomous growing solution. This approach may differ for different suppliers, but we’ve found that this works best.
Stage 1: Connected. The first stage is where environmental and operational data becomes digitized, what we call Digital Horticulture. Data from multiple silos is unified and stored in the cloud via a data gateway.
To make sense of it, the data needs to be visualized with tools such as operational dashboards which growers can directly use for crop monitoring and decision making. Figures 2 and 3 provide examples of customizable dashboards showing critical growing metrics such as light levels, CO2, temperature and more.
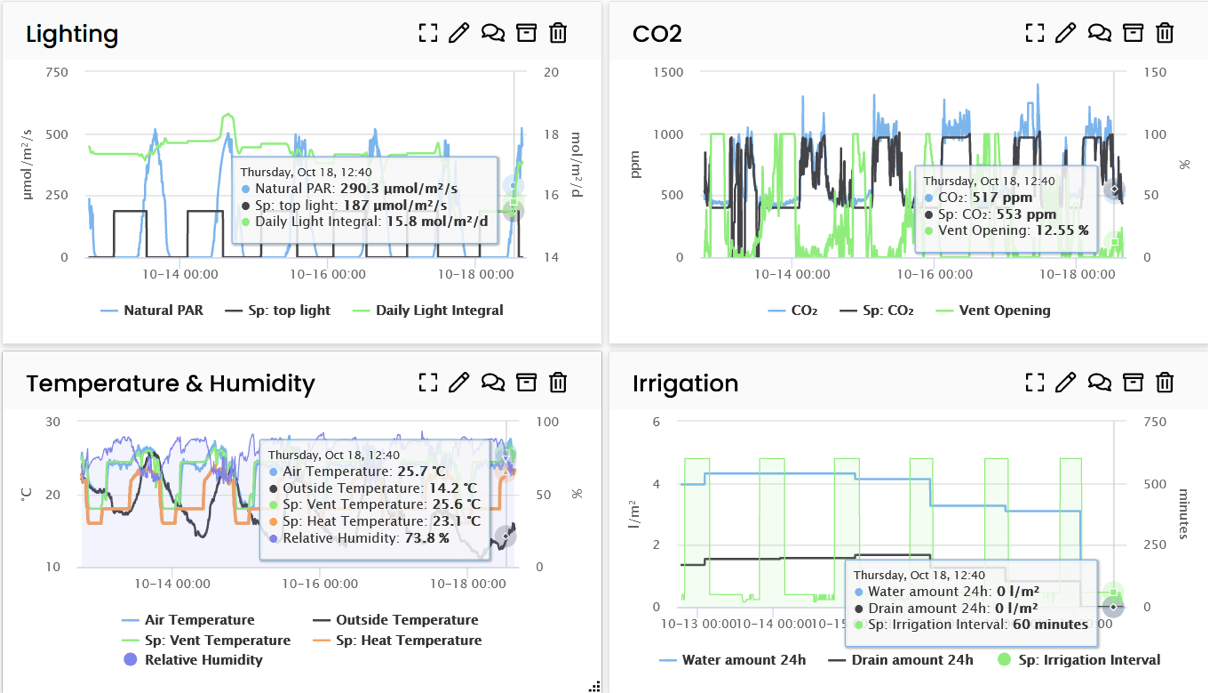
Figure 2. It’s important that users can visualize and analyze data across multiple complex data points easily, in one place. Using sample climate dashboards on Koidra’s Krop Manager app as an example, users can zoom in to see the data in the same time range across multiple data groups (or charts). Moreover, by hovering over one data point at one time, they can see the other data points at the same time. Data can be easily grouped into logical chart groups such as Lighting, CO₂, Temperature & Humidity, etc.
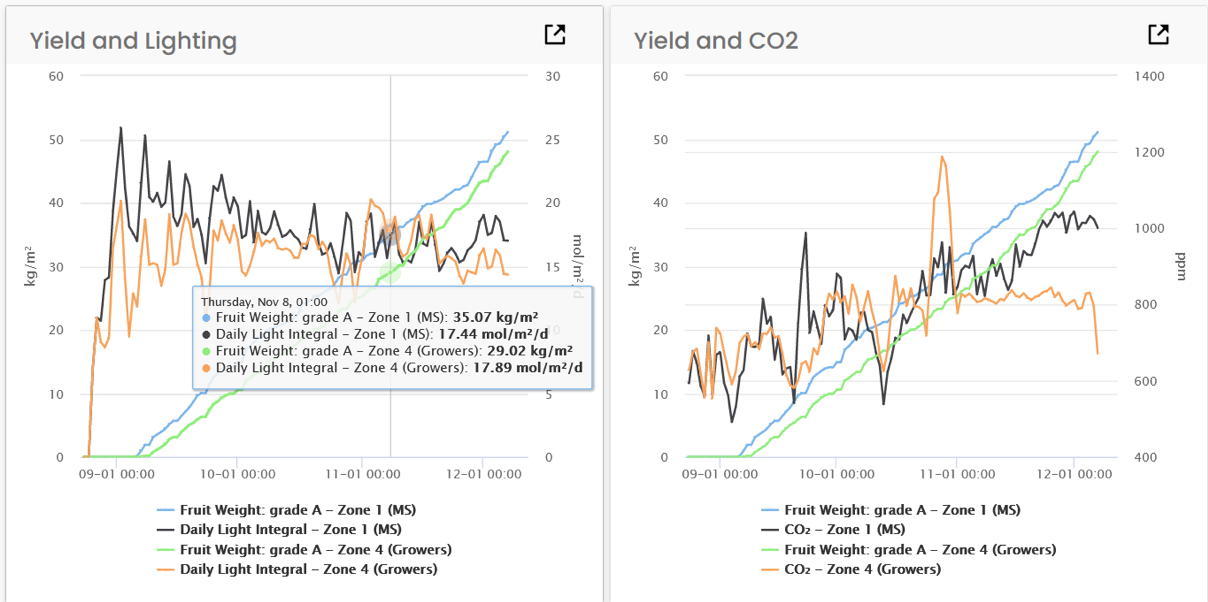
Figure 3: Helpful apps can allow growers to compare the performance across zones or across seasons to help growers understand what caused, for instance, higher or lower yields. Using screenshots from Koidra’s Krop Manager as examples: the left shows the differences, in terms of yield and daily light integral (DLI), between the two zones growing the same crop (cucumber) during the same season; and the right shows the differences between the same zones but in terms of yield and CO₂. What metrics growers want to see and compare are fully customizable.
This starting point is the basic process of digital transformation in greenhouse growing. Even without AI, this stage can produce high return on investment (ROI) on its own.
Before investing in a data platform, there are some important questions to ask: Is it another silo in your existing mix of data silos (i.e. isolated, unintegrated data)? Data silos are a disease to your business, even if you don’t see it yet. Can it be integrated with your existing or new control systems? Can the data be turned into actionable insights? Once you find the data useful, can you operationalize upon that data (i.e. can the control system use it)?
Stage 2: Digital Twin. The second stage involves the implementation and customization of a “digital twin”, the term used for a virtual model of the growing environment based on real-world data from other sources.
With scientific computing and machine learning technologies, the digital twin can be used to predict crop growth and other biological indicators such as photosynthesis, transpiration, leaf area, and more. In other words, the digital twin provides growers with new smart biosensors that they didn’t have before, without purchasing or deploying any extra hardware. Scientific Machine Learning + Data = Digital Twin
What if a digital twin differs from reality? Well, then it’s not ready for commercialization yet. Users may not be able to immediately detect the difference in real-time, but they will eventually be able to tell. For example, if the digital twin says photosynthesis and crop growth should be this much, but growers get lower than expected yield at the end of the season, it’s probably a bad prediction.
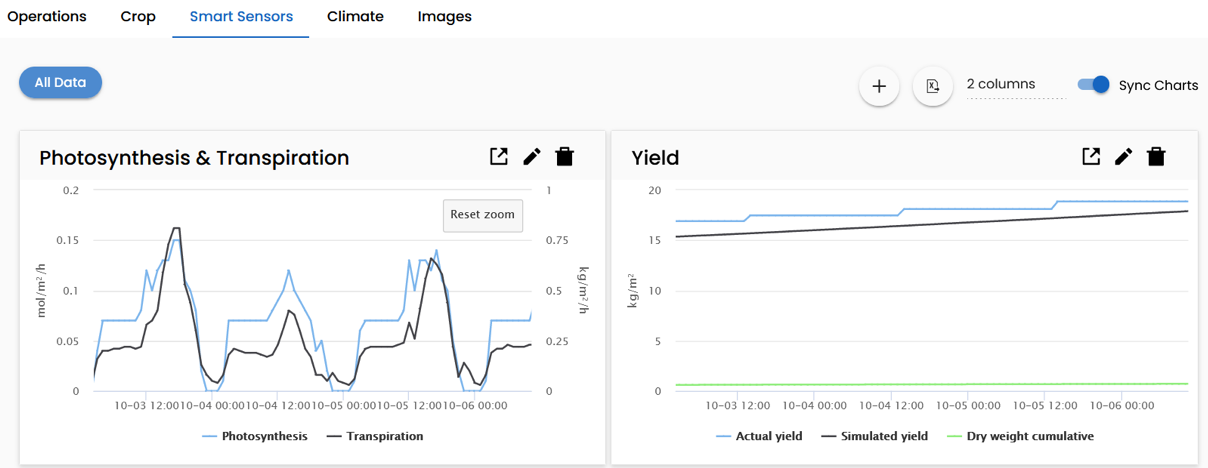
Figure 4: The digital twin enables growers to understand the crop growth, in real time, by modeling and displaying biosensors such as photosynthesis, transpiration, dry weight accumulation, etc.
Stage 3: Autonomous Growing. In the third stage, a computer can take over the tedious task of climate and crop control decision-making. By combining AI with a grower’s expert knowledge, the autonomous growing model can imitate how a data-driven grower would make decisions using the same inputs.
Note that each stage of this roadmap is designed to be a standalone success—providing return on investment by itself while the next one is still in progress. Even at the first stage, growers can already improve existing operations and decision-making processes with better data management and better data visualization tools.
Getting started with Digital Horticulture
The first stage of our roadmap is all about Digital Horticulture, i.e. digital transformation in greenhouse growing. Let’s take a closer look at what this means and what is needed for success.
A well-designed Digital Horticulture platform has three key pieces of hardware and software.
The first piece is the data hub that is installed at the site. It reads data from multiple data sources on the ground and sends them to the cloud for persistent storage and anywhere-access.
The best data hubs can read data from both your existing control systems (e.g. Priva, Hoogendoorn, Argus, etc.) and from any new sensors that you may want to install at low-cost and low-friction without having to go through the legacy system. This avoids two significant problems:
- Data silos. Standard dataloggers can generally only read data from new sensors. What’s more, you typically need an expert to perform the installation. Although the data logger hardware itself sells in the range of $1,000 to 2,000, a full installation can easily cost up to $15,000 to 20,000. More importantly, once installed, you would end up with two siloed systems: the new data logger and the legacy control system.
- Vendor lock-in: Few companies today can readily help extract data from existing control systems. For most growers, their data is essentially held hostage. This is known in the tech industry as “vendor lock-in”.
These are the main reasons why greenhouse growers have generally not kept up with digital transformation as readily as in other industries. And for growers who want to adopt AI, many are stuck at the starting line.
The second piece is the data management system. This component stores your data in the cloud, potentially in very large volumes. The best data management systems have two important characteristics:
- The system should continue to be usable as the business grows over a long period of time, without incurring significant new costs or the need to delete older data.
- Data Portability. Users, as well as third-party apps functioning on behalf of users, should be able to access the data, either historical or real time, freely and efficiently.
Finally, the third piece is business intelligence tools. Here, growers get easy-to-use interfaces for consuming, understanding, and making sense of data, both historical data and real-time data. The best business intelligence tools can be accessed from anywhere, on any device with internet access.
When considering Digital Horticulture platforms, the ideal IoT solution should have all of these pieces:
- A data hub that works with multiple sources, e.g. sensors, legacy control systems, auxiliary databases.
- A cloud-based data management system that ensures scalability and data portability.
- Easy-to-use business intelligence tools that provide actionable information from the data.
This is exactly the kind of solid data foundation that’s needed—to make your farming business more efficient today and to move toward autonomous growing and AI tomorrow.
———————-
Kenneth Tran is CEO of Koidra Inc., an AI solutions supplier active in horticulture. John Chang is head of software engineering of Grönska, a vertical farm in Stockholm. For questions, contact Koidra at hello@koidra.ai.
All other images courtesy of Koidra.
Print this page