Features
Business
Management
THE SURVEY SAYS: Another good year for growers
Sixth annual Grower Survey finds higher sales in 2016 along with strong profit margins for many respondents…and a good dose of optimism for the current year.
April 11, 2017 By Dave Harrison
 About 27 per cent of respondents listed “vegetables” as their primary crop.
 May 2017 – Combine anecdotal feedback from growers mingling at industry events with results from our sixth annual Grower Survey, simmer and stir, and you’ve got a recipe for another fairly successful year (2016) in the commercial greenhouse sector.
Sales were solid, or at least above average for many, and the weather last year was largely on the side of growers.
Energy costs are becoming an issue, as growers tend to use lighting to extend the season and serve new markets. Electricity costs in most regions have been rising. Helping buffer those challenges is the fact natural gas prices remain at relatively low levels, and the pundits are calling for this trend to continue for some time. But cap and trade (or carbon taxes) costs are coming into play; the impact is now being felt and will be reflected, no doubt, in next year’s survey.
Our survey is far from scientific, and provides only a cursory glimpse of what’s going on in the sector. (Numbers in brackets are percentages. All numbers are rounded off.)
Who filled out this year’s survey? About half were wholesale growers, followed by vegetable growers (23 per cent), retail growers (20), and seven per cent were in propagation.
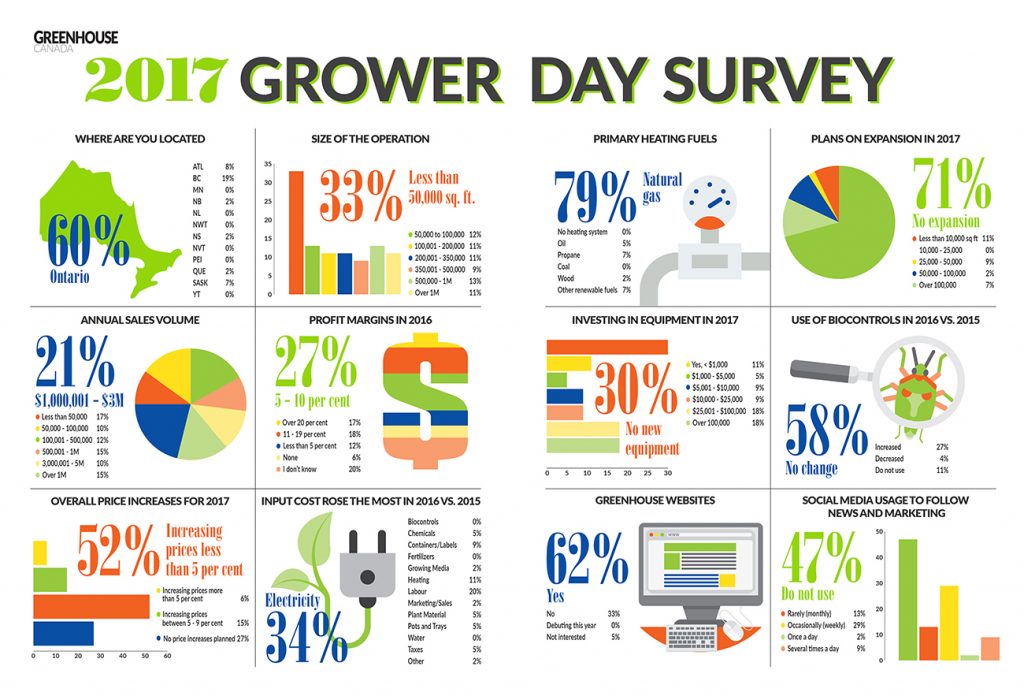
And where are they from? Ontario represented 60 per cent of the respondents, followed by British Columbia (19), Alberta (9) and Saskatchewan (7). We also had respondents in New Brunswick (2), Nova Scotia (2), and Quebec (2).
Size of operations: As in the previous five surveys, most of those taking part have smaller operations. About a third were less than 50,000 square feet, with 13 per cent between 50,000 and 100,000, and a further 13 per cent were between 500,00 and a million square feet. At 11 per cent each were those operations in the range of 100,001 to 200,000, and 201,000 to 350,000 square feet, while about nine per cent of respondents had between 350,001 and 500,000 square feet. About 11 per cent were over one million square feet.
Serving which market: On the question “Who Is Your Primary Customer,” 21 per cent listed “Own Retail Shop,” followed by “Wholesale Distributor” (20), “Mass Merchandisers/Box Stores (16), “Farmers’ Markets” (13), “Independent Garden Centres” (11), “Other Growers” (nine), “Supermarkets/Grocery Stores” (seven), and “Independent Retailers/Florists” (four).
What are the “Primary” crops represented in the survey? Some 27 per cent grow “Greenhouse Vegetables,” while about 22 per cent grow “Ornamental Bedding Plants” and a similar percentage grow “Flowering Potted Plants.” Rounding out the survey were “Perennials” (seven), “Herbs and Vegetables as Bedding/Container Plants” (five), “Fresh Cut Flowers” (five), “Trees” (three). Filling out the list were “Tropicals,” “Woody Ornamentals,” and “Plugs and Propagation Material.”
Among “minor” crops grown were: “Herbs and Vegetables as Bedding/Container Plants” (45 per cent); “Flowering Potted Plants” (36); “Ornamental Bedding Plants” (32); “Greenhouse Vegetables” (25); “Perennials” (25); “Foliage” (19); “Plugs and Propagation Material” (19); and “Fresh Cut Flowers,” “Woody Ornamentals,” and “Trees,” all at about 11 per cent. (Respondents could select more than one “minor” crop.)
Sales up or down: Last year was definitely a good year for most respondents with 23 per cent having year-over-year sales increases of more than 10 per cent, and 32 per cent recording increases of between five and 10 per cent. Thirteen per cent had sales up by less than five per cent, while 23 per cent had 2016 sales levels that were about the same as 2015. Only eight per cent had lower sales in 2016.
Taking a look back three years ago, growers listed the following margins: Over 20 per cent (eight per cent); 11-19 per cent (16); five to 10 per cent (33); less than five per cent (6); no profit margin (12); and “Do Not Know” (24 per cent).
Sales forecasts: Again, on the question of sales forecasts for this year, only one per cent of respondents say they’ll have lower levels in 2017. Thirty-nine per cent are eyeing a stand-pat year, while of those anticipating increases, 31 per cent are hoping for hikes of up to 10 per cent, while 29 per cent are looking at increases of over 10 per cent.
Crop threats: We were also curious about pests and disease pressures in each quarter of 2016 compared to 2015, with the following feedback.
- Early Season of January through March: Worse in 2016 (Pests – 11 per cent, Diseases – seven ); About The Same (Pests – 70, Diseases – 76); and Not As Bad (Pests – 19, Diseases – 17).
- Spring (April through June): Worse in 2016 (Pests – 22 per cent, Diseases – 11); About The Same (Pests – 54, Diseases – 74); and Not As Bad (Pests – 24, Diseases – 15).
- Summer (July through September): Worse in 2016 (Pests – 24 per cent, Diseases – nine); About The Same (Pests – 63, Diseases – 78; and Not As Bad (Pests – 13, Diseases – 13).
- Autumn (October through December): Worse in 2016 (Pests – 17 per cent, Diseases – seven ); About The Same (Pests – 65, Diseases – 83); and Not As Bad (Pests – 17, Diseases – 11).
About 27 per cent of respondents listed “vegetables” as their primary crop.
Labour:
There was a slight increase in employment, with 20 per cent having increases of up to 10 per cent last year, while five per cent welcomed more than 10 per cent. Seventy per cent held staffing levels to those of 2015, while about five per cent saw decreases of less than five per cent.Off-shore workers remain an important resource for the industry, with a little more than a third of respondents (36 per cent) employing off-shore workers.
Looking ahead to this year, there will be a modest gain in employment from among our respondents. Most (68 per cent) are maintaining employment levels, while 25 per cent are anticipating staffing increases of up to 10 per cent.
Investing in facilities/equipment: Our respondents reported little expansion last year, with only 18 per cent citing projects of 10,000 square feet or less. Some 76 per cent did not have projects last year.
On the question of “Investing in New Equipment/Technology in 2016,” about 27 per cent had nothing to report. However, there were new installations/replacements at a number of greenhouses. Twenty-three per cent invested more than $100,000, while 14 per cent had $25,000 to $100,000 in purchases, and an additional 14 per cent spent $5,001 to $10,000. Nine per cent invested between $10,001 and $25,000, seven per cent spent $5,000 or less, and another seven per cent spent $1,000 or less.
Business threats and opportunities: We asked about “Business Threats in the Coming 3-5 Years.” Leading the way was “Energy Costs,” followed by “Market/Prices.” Rounding out the top three was “Taxes/Regulations.” The other threats included “Labour Shortage,” “Currency Fluctuations,” and “Imported Competition.”
On the question of “Business Opportunities in the Coming 3-5 Years,” it was virtually a dead heat among “Non-Traditional Products,” “Buy Local Movement” and “Organic/Green Products. All three are definitely strong contenders. Finishing a little behind the pack this year was “Export Markets.”
Pricing forecasts: A good indication of market confidence are pricing forecasts. Among survey respondents, the majority are hiking prices, with only 27 per cent holding the line. Of those increasing prices, 52 per cent are making adjustments of less than five per cent, while 15 per cent are looking at hikes of between five and nine per cent and six per cent are increasing by more than 10 per cent.
Thanks to all growers who participated this year, and we look forward to reconnecting next January…and hopefully to equally positive survey results.
Print this page